What is a Gantt chart? Definition, components, and examples

Share What is a Gantt chart? Definition, components, and examples
Explore more from
Team productivity


You’ve brainstormed compelling ideas, aligned with stakeholders, and defined your goals. Now comes the challenge: transforming that vision into an actionable, realistic timeline your team can follow. Without a clear plan, it’s easy to fall out of sync or hit bottlenecks.
That’s where Gantt charts come in. These timeline-based tools give cross-functional teams a visual structure for mapping tasks, milestones, and dependencies, making it easier to stay on track.
Read on to learn:
- What a Gantt chart is and what it’s used for
- The different types of Gantt charts and examples
- How to create a Gantt chart in five simple steps
- Important elements, best practices, and pros and cons
Gantt chart definition
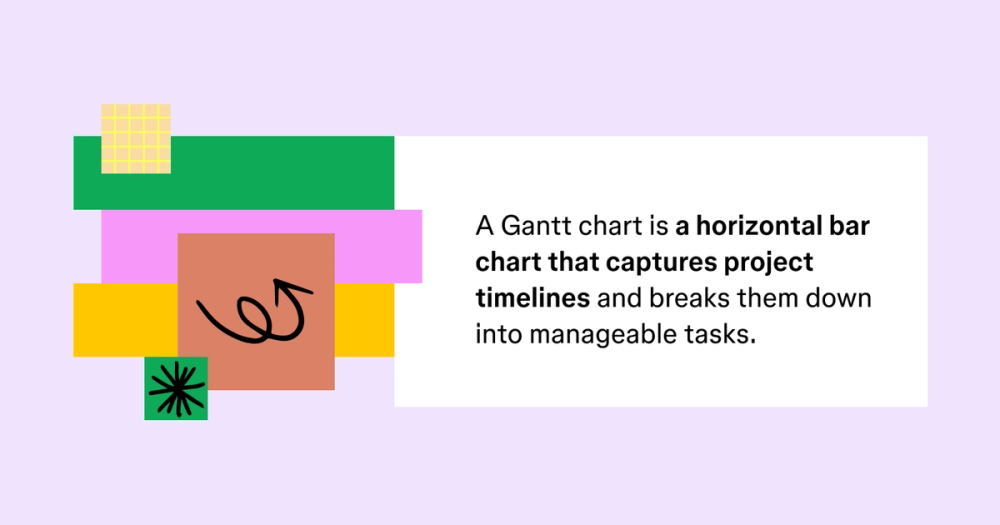
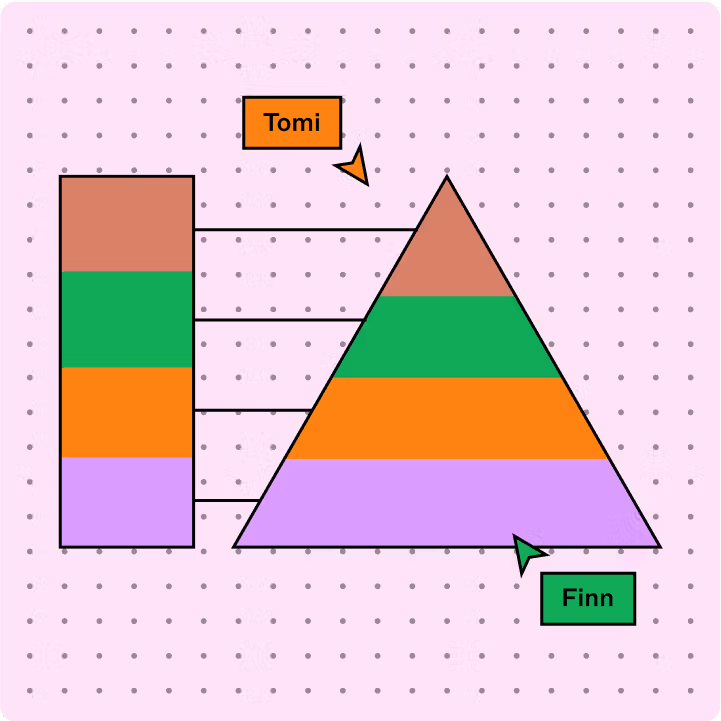
A Gantt chart is a horizontal bar chart that visualizes project timelines by breaking them down into smaller, more manageable tasks. Mechanical engineer Henry Gantt originally developed it in the late 1800s to track how well employees were doing their jobs. Now, Gantt charts have become a staple in project management. They help assign team responsibilities, allocate resources, and show which project tasks depend on others.
Each bar on a Gantt chart represents a project task, with the length of the bar showing how long the task takes to complete. The task bars line up on a timeline to show when each task starts and finishes, much like a Kanban board.
What is a Gantt chart used for?

Common uses for Gantt charts include:
- Managing complex projects. Gantt charts make it easier for project managers to visualize each phase of a project and break down tasks into smaller, more manageable parts.
- Tracking project progress. Tracking milestones and other dates within your Gantt chart helps keep projects on schedule and makes it easier to adjust the project timeline if needed.
- Monitoring task dependencies. Task dependencies make sure one task doesn’t begin until the previous one is complete. Gantt charts clearly visualize dependencies between tasks, which helps prevent project delays.
Say your team has to design a Web page as part of a site redesign. By plotting this task on a Gantt chart, your team can see the start and end dates for individual tasks across the project. This makes it easy for cross-functional stakeholders to know when the page will be live.
Which teams often use Gantt charts?
Any team managing deliverables or timelines can benefit from Gantt charts. Common users include:
- Design
- Marketing
- Engineering
- Construction
- Event planning
- User experience (UX)
- Software/product development
How to know if a Gantt chart is right for your project
Gantt charts come with clear benefits, but they’re not always the right fit. Here’s a quick overview of the pros and cons to help you decide if a Gantt chart maker is right for your project.

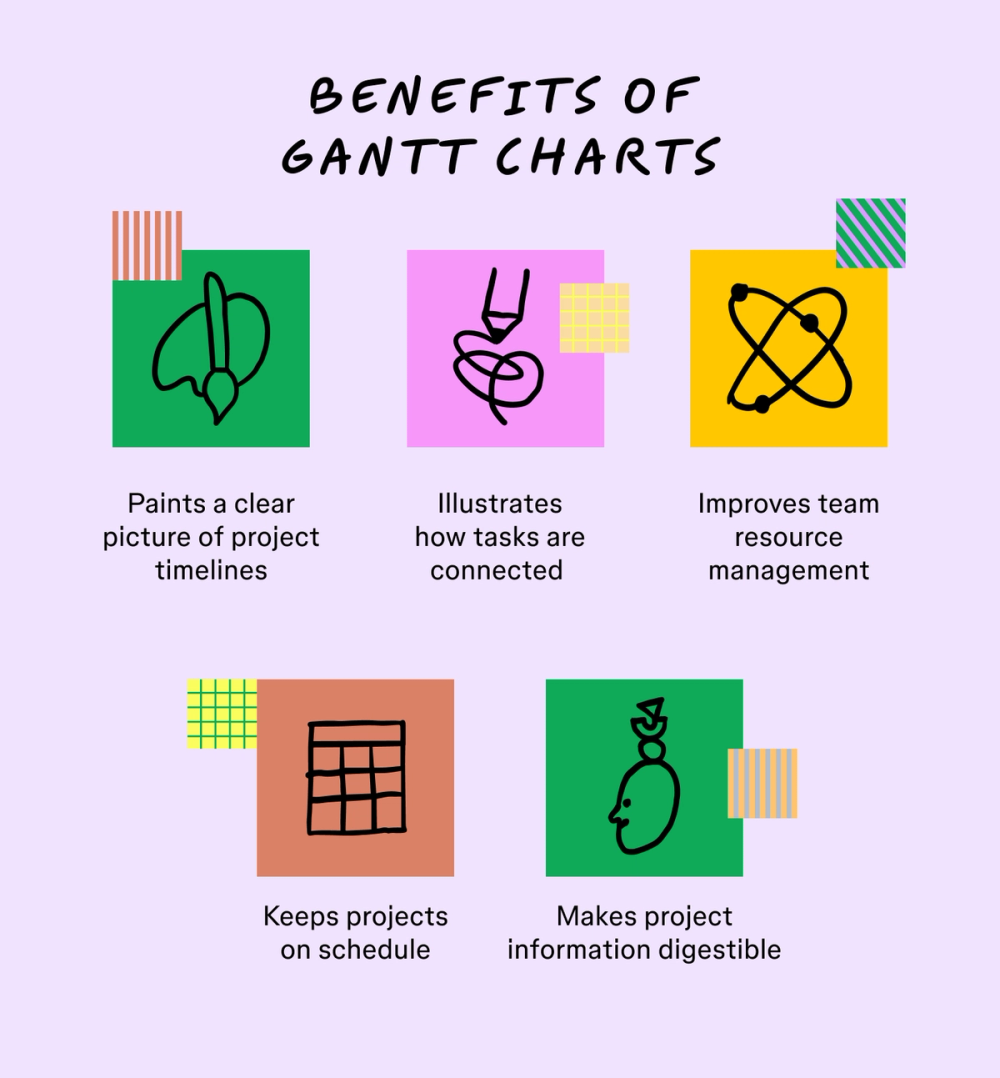
Benefits of Gantt charts:
- Visual clarity. Gantt charts give teams a high-level overview of all milestones and major tasks within your project from start to finish.
- Clear task relationships. Dependencies and overlaps are easy to identify, making project sequencing simple to manage.
- Better resource planning. With a complete view of the project and assigned tasks, it’s easier to spot when team members are overloaded or underutilized.
- Stay on schedule. Gantt charts flag the amount of free time between tasks and help teams identify what needs to happen next to keep projects on schedule.
- Improved communication. A clear visual timeline helps stakeholders understand the plan, identify risks, and stay aligned.
Some drawbacks of Gantt charts to consider:
- Difficult to scale. Large projects with lots of dependencies may be challenging to update or interpret.
- Lacks nuance. Some tasks are too complex to represent accurately with a bar on a timeline. Consider flowcharts or swimlane diagrams as alternatives.
- Needs frequent updates. If not maintained regularly, a Gantt chart can quickly become outdated and misleading.
- Less flexible for agile workflows. Gantt charts are better suited for linear project plans than for agile methodologies. Agile teams may prefer alternative tools like a product roadmap or a task board.
Types of Gantt charts
Different projects require different types of Gantt charts. Choosing the right format helps ensure your chart communicates what your team needs most.
Progress Gantt charts
Progress Gantt charts show how much of each task is complete. Shaded bars or percentage indicators visually track progress, so it’s easy to see what’s on track—or falling behind.
Use progress Gantt charts to:
- Get a quick status check on all tasks
- Flag overdue or stalled items
- Show momentum to stakeholders
Linked Gantt charts
Linked Gantt charts, also known as dependency Gantt charts, emphasize the relationships between tasks. Arrows connect tasks that are dependent on each other, showing the sequence in which tasks must be completed.
These are ideal for projects where one delay can create a domino effect. These are ideal for projects where one delay can create a domino effect. Linked charts help teams understand what must happen first, what can run in parallel, and where blockers might appear, helping identify the critical path and potential bottlenecks.
How to make a Gantt chart in five simple steps
Gantt charts are highly customizable and useful for straightforward projects (like writing an email nurture campaign) to complex workflows (like designing a new product).
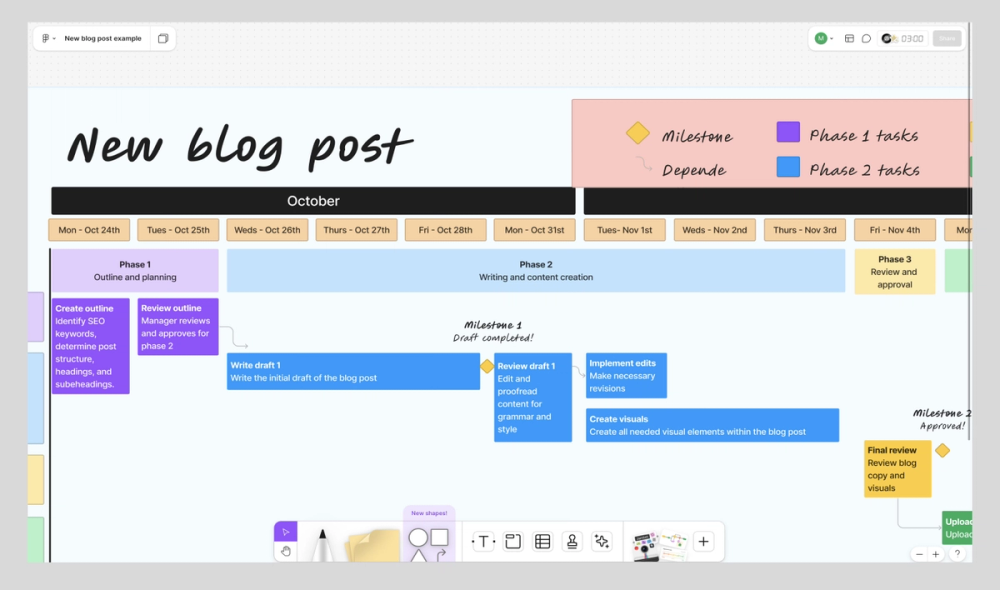
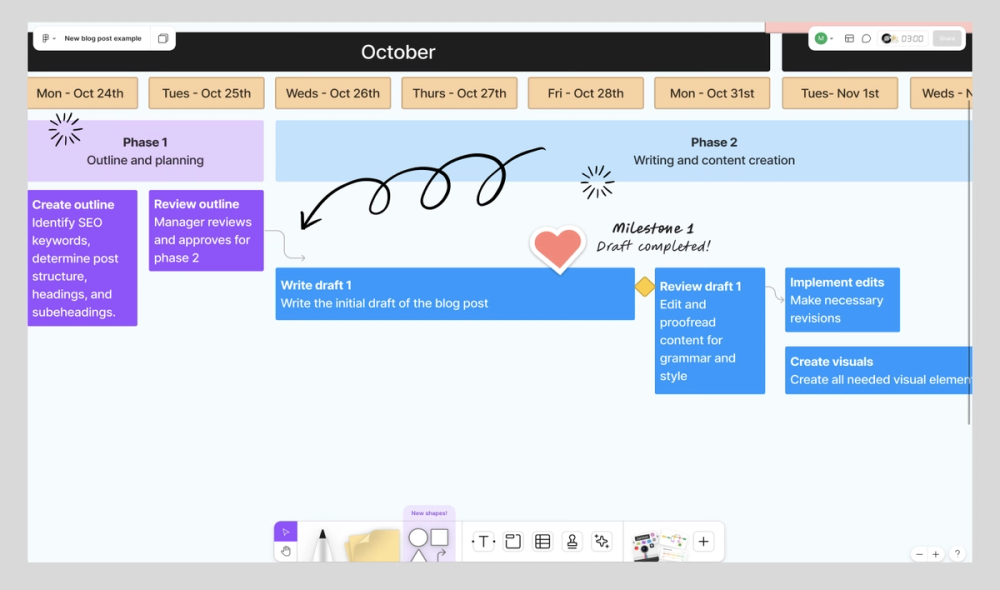
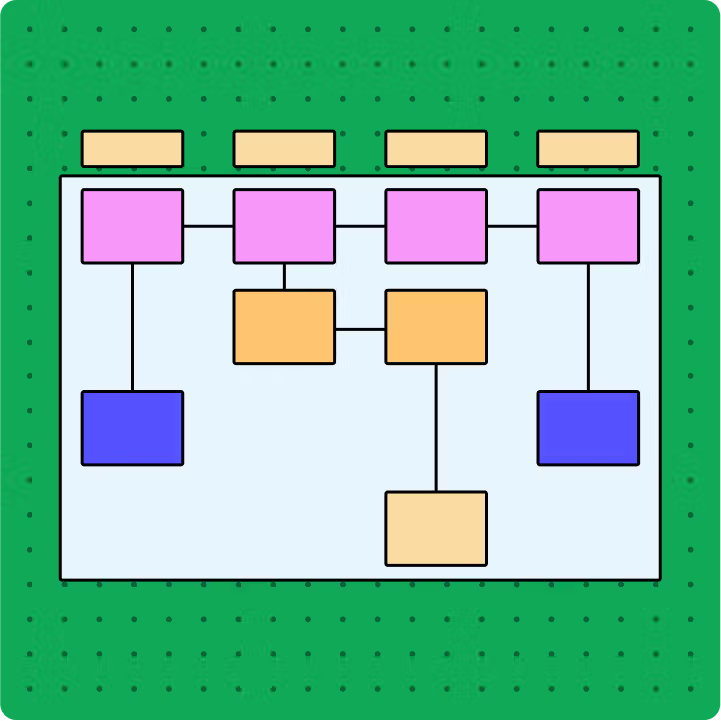
Here’s a simple Gantt chart layout based on a template from the FigJam community for planning a blog post.
Step 1: Gather project details
When you kick off a project, start by collecting core project info:
- Project start and end date
- Project name
- Key deliverables
- Important milestones
- Dependencies
- Project team members
Pro tip: Note any follow-up tasks you’ll want to complete after your project wraps up. For example, with a site redesign, you may want to create tasks after the site launch for how your team will monitor future Web performance.
Step 2: Break down projects into tasks
Break key deliverables down into manageable tasks. Then, list the tasks vertically on the left side of your Gantt chart and make sure they’re specific. For example, instead of a task like “Build Web page,” you might have tasks like “Choose illustration,” “Change button on sign-up form,” and “Sketch out payment process flow.”

Pro tip: If you don’t have a project manager to help, create a simplified work breakdown structure (WBS) to identify deliverables. A WBS sorts tasks into categories and breaks them down by order of importance, making it easier to plan your project schedule on your Gantt chart.
Step 3: Schedule tasks and identify dependencies
Next, plot your timeline across the top and draw horizontal bars for each task, starting at the task’s start date and ending at its finish date.
Organize tasks into a sequence of activities—also known as dependencies—showing the order in which tasks must be completed. Typically, one task can’t start until the one before it finishes. For example, to start task B, task A must finish.
This Gantt chart example labels dependencies by using arrows to connect one task to another. For example, the Gantt chart shows that to begin writing draft one, the outline needs approval.

Pro tip: Identify your critical path—the sequence of dependent tasks directly affecting your project finish date—during scheduling. Any delayed task on the critical path delays the entire project.
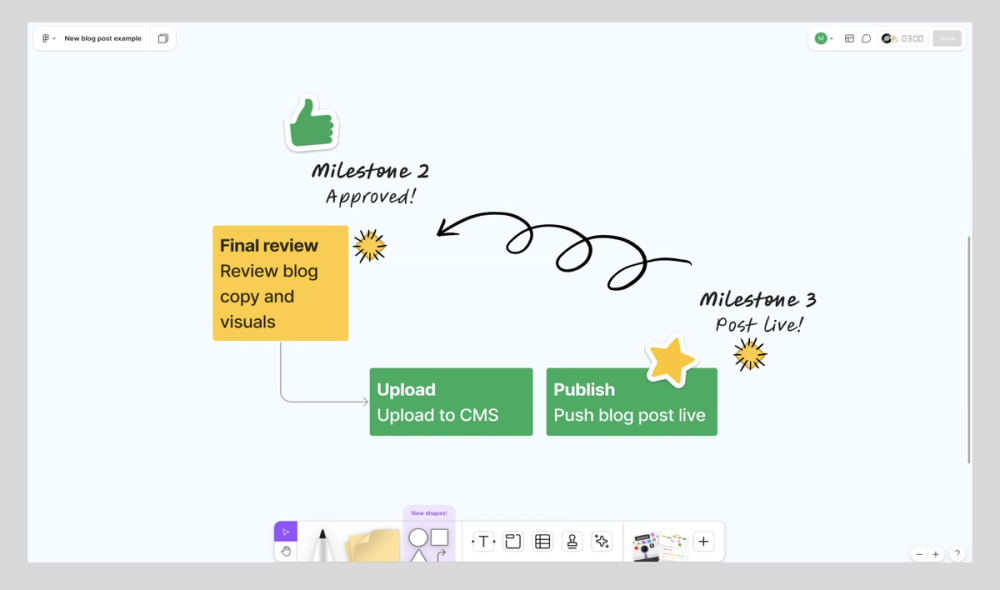
Step 4: Flag project milestones
Use milestones to give your team a high-level overview of important project dates. Milestones usually include start and end dates for project phases, deliverable due dates, approvals, meetings, or presentation days.
A diamond or other symbol usually marks these points in a project timeline to make them stand out. The chart shows that completing the first draft of the blog post is a milestone, along with internal approval, and then publishing.

Pro tip: Milestones may look different for different projects, so tailor them to your team. For example, schedule check-in meetings at the end of each project phase to align team members before moving on to the next phase.
Step 5: Enhance your chart with colors
Color makes your chart easier to scan. You can color-code by:
- Status of a project or task
- Priority level
- Responsible team member
- Project phase
- Task type

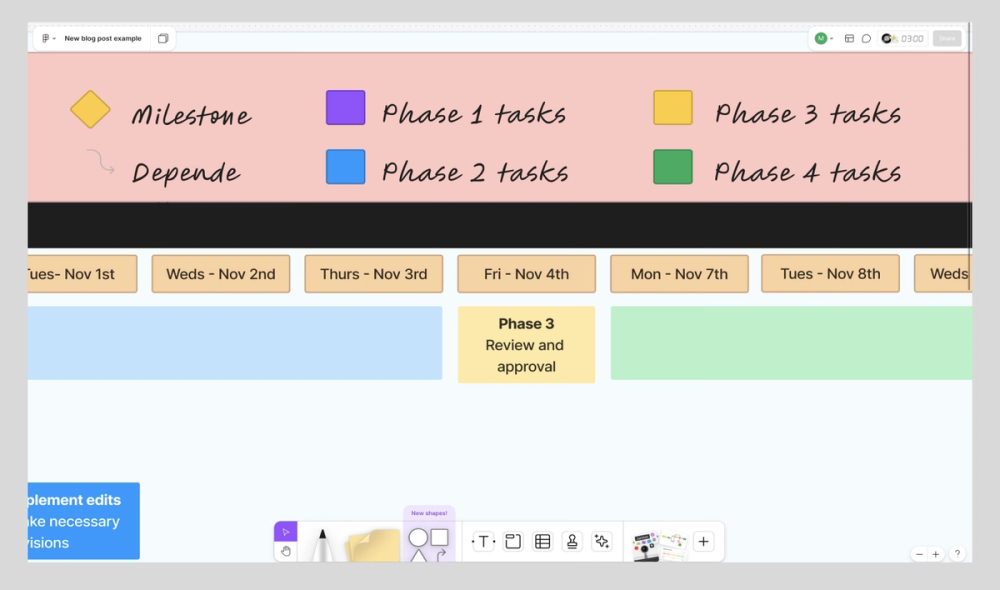
Pro tip: Remember to include a legend that shows what each color or symbol represents on your chart.
Important elements of a Gantt chart
To build (or read) a Gantt chart effectively, it helps to understand its core components:
- Task list. The task list, often organized by priority or category, is a comprehensive list of all tasks required to complete the project. It’s usually displayed on the vertical axis.
- Timeline. The horizontal axis represents the overall project duration. It’s typically broken into days, weeks, or months.
- Dateline. The dateline is a vertical line on a Gantt chart indicating the current date. This helps visualize the project’s progress in real time.
- Critical path. The critical path determines the project’s minimum duration. It’s the sequence of dependent tasks that must be completed on time to ensure the project finishes on schedule. Any delays in these tasks can affect the entire project timeline.
- Dependencies (arrows). Relationships between tasks show which ones must be completed before others can start. Arrows with lines connect tasks to illustrate dependencies, workflow, and the critical path method.
- Milestones (diamonds). Diamond symbols represent significant events, key achievements, or deliverables in the project timeline.
- Progress indicators. Visual markers, such as shaded bars or percentages, indicate the completion status of tasks.
- Resources and assignees. This element provides information about who is responsible for each task and which resources are allocated.
- Task duration bars. Horizontal bars represent the start and end dates of tasks and activities, indicating their durations.
Gantt chart best practices
To get the most out of a Gantt chart and make it an invaluable asset, you need to go beyond the basics. These best practices help you stay organized and minimize confusion.
- Segment large tasks. Break down complex tasks into smaller, manageable subtasks.
- Add important details and documents to tasks. Make sure each task includes relevant information, file attachments, links, and notes to provide additional context.
- Display start and end dates for each task. Clearly indicate when each task should begin and end.
- Set up custom labels to tag and filter tasks. Use tags and labels to categorize tasks and filter them for better organization and analysis.
- Stay mindful of dependencies. Regularly review task relationships to prevent scheduling conflicts and ensure they’re scheduled in the correct order, considering any dependencies.
- Never assign work without checking team availability. Confirm team members have capacity before assigning tasks to them.
- Track non-work periods. Account for holidays and time off in the project schedule to avoid scheduling conflicts.
- Monitor progress regularly. Track task completion and update the chart to reflect the project’s current status.
- Ask for feedback and update as needed. Regularly ask team members for feedback and update the chart based on their input.
Gantt chart FAQ
Keep reading for answers to frequently asked questions about Gantt charts.
What is a Gantt chart template?
A Gantt chart template is a pre-designed framework that helps you quickly set up a Gantt chart without starting from scratch. You can also create a Gantt chart in Excel, Google Sheets, or other specialized software.
Can Gantt charts handle task dependencies?
Yes, Gantt charts can illustrate task dependencies, showing how the start or end of one task relates to another.
Are Gantt charts suitable for all project types?
While Gantt charts are versatile, they are best suited for projects with clear, linear timelines and may not be ideal for highly iterative or agile projects.
Build your next Gantt chart in FigJam
Gantt charts give you a bird’s-eye view of your entire project so you can manage complexity without sacrificing momentum. Whether leading a marketing campaign or coordinating a product launch, FigJam’s Gantt chart template makes it easy to produce clear charts that will help you track and manage your team’s project timeline.
- Drag and drop professionally designed shapes and arrows onto FigJam’s ready-made template, or utilize other premade templates from the FigJam community.
- Collaborate with team members in real time with FigJam’s shared online whiteboard, using cursor chat, emojis, and polls to keep everyone engaged and on track.
- Once you’ve planned your project timeline, use FigJam’s project kickoff template so team members know what to expect for the project ahead.
- Use the meeting notes template to help you organize your talking points.
Ready to take control of your project timeline?
Keep reading

What is a RACI matrix?
Learn how to capture the roles and responsibilities of project stakeholders.

Strategic vs. tactical planning
While strategic planning involves big-picture thinking, tactical planning covers the nitty-gritty of turning strategy into action.

What is sprint planning?
Find out how to plan sprints effectively with a step-by-step guide, pro tips, and tricks from FigJam.