What is an affinity diagram?

Share What is an affinity diagram?
Explore more from
Team productivity

It's a familiar design challenge. When feedback pours in from stakeholders, users, and team members, finding meaningful patterns becomes crucial. Which inputs matter most? What deserves priority? Affinity diagrams transform this scattered feedback into structured, actionable information by grouping related ideas and surfacing key themes.
Read on to learn:
- What an affinity diagram is
- How to prepare for diagramming
- How to create your own diagram
- The benefits of affinity diagrams
- Example affinity diagrams for designers
What is an affinity diagram?
An affinity diagram, also called an affinity chart, streamlines team brainstorming by grouping ideas based on similarities and themes. Japanese anthropologist Jiro Kawakita invented the process in the 1960s to organize vast amounts of data. As a result, affinity diagramming is sometimes called the “KJ method” after its creator.
Teams capture ideas on sticky notes and then cluster them to reveal patterns and connections. This collaborative process helps teams identify patterns, make decisions, and uncover insights that might otherwise remain hidden.
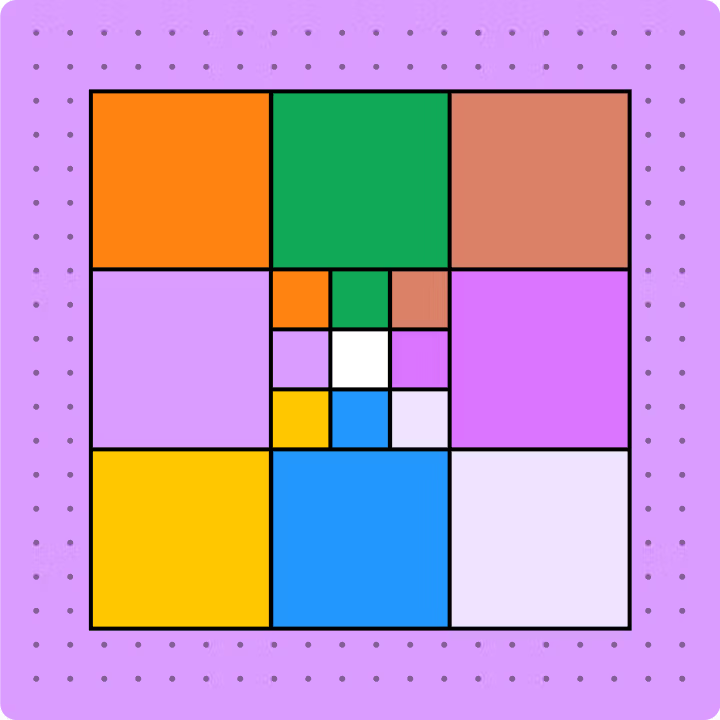
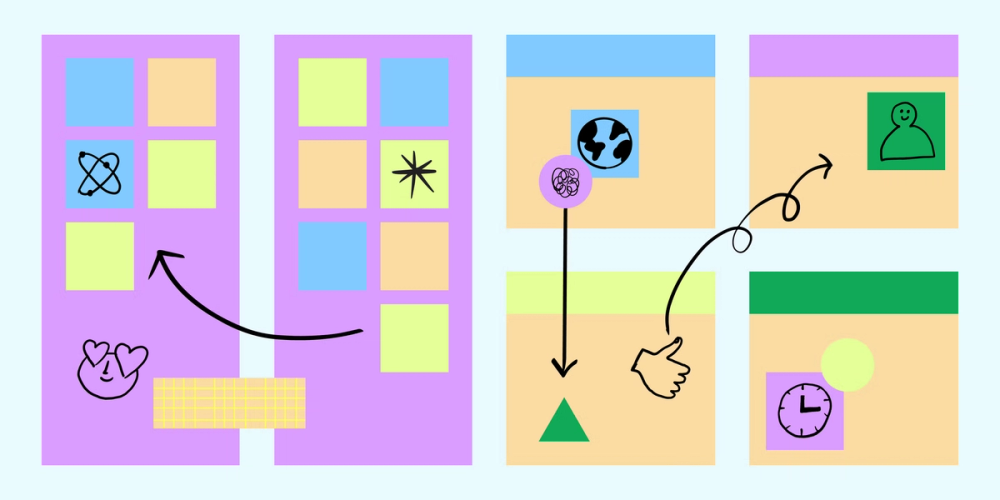
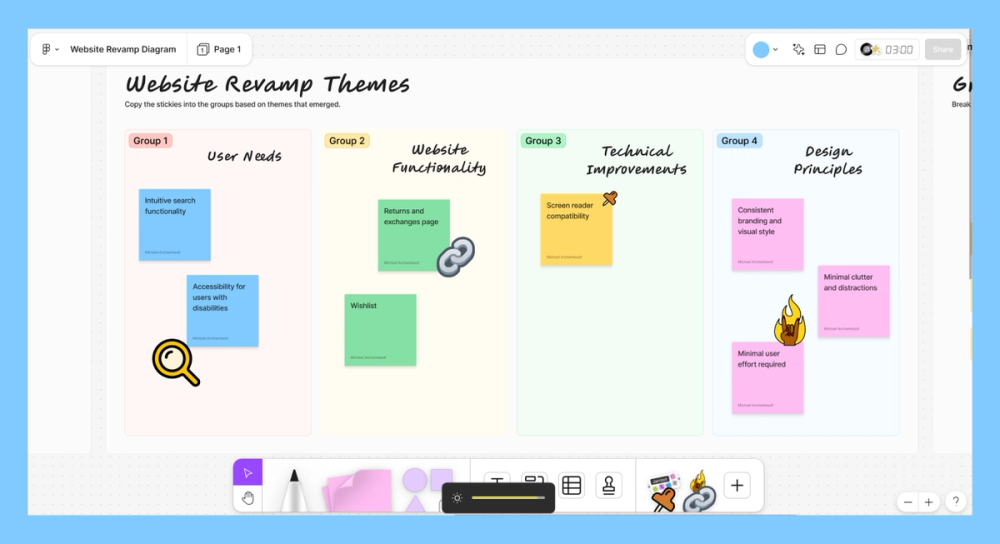
Color-coding highlights similar ideas, revealing natural relationships among different data points—as shown in this FigJam affinity diagram example. A brainstorming session facilitator records each idea, clusters similar ideas, uncovers key insights, and plans the next steps. Collaboration among key stakeholders is essential in this methodology.
Preparing for affinity diagramming
The beauty of affinity diagramming is its simplicity, which allows for a free flow of ideas during the brainstorming process. To facilitate a successful affinity diagram session, consider these tips:
- Assemble relevant data. Ensure your team has the data it needs, like results from user research, competitive analysis data, and previously brainstormed ideas.
- Communicate the process. Be sure your team understands how the affinity diagram works.
- Ensure a set focus. Clarify the specific problem you’re trying to solve or the goals you’re hoping to meet.
- Get your workspace ready. Prepare either physical materials like sticky notes and markers or use a digital whiteboard like FigJam.
How to create an affinity diagram

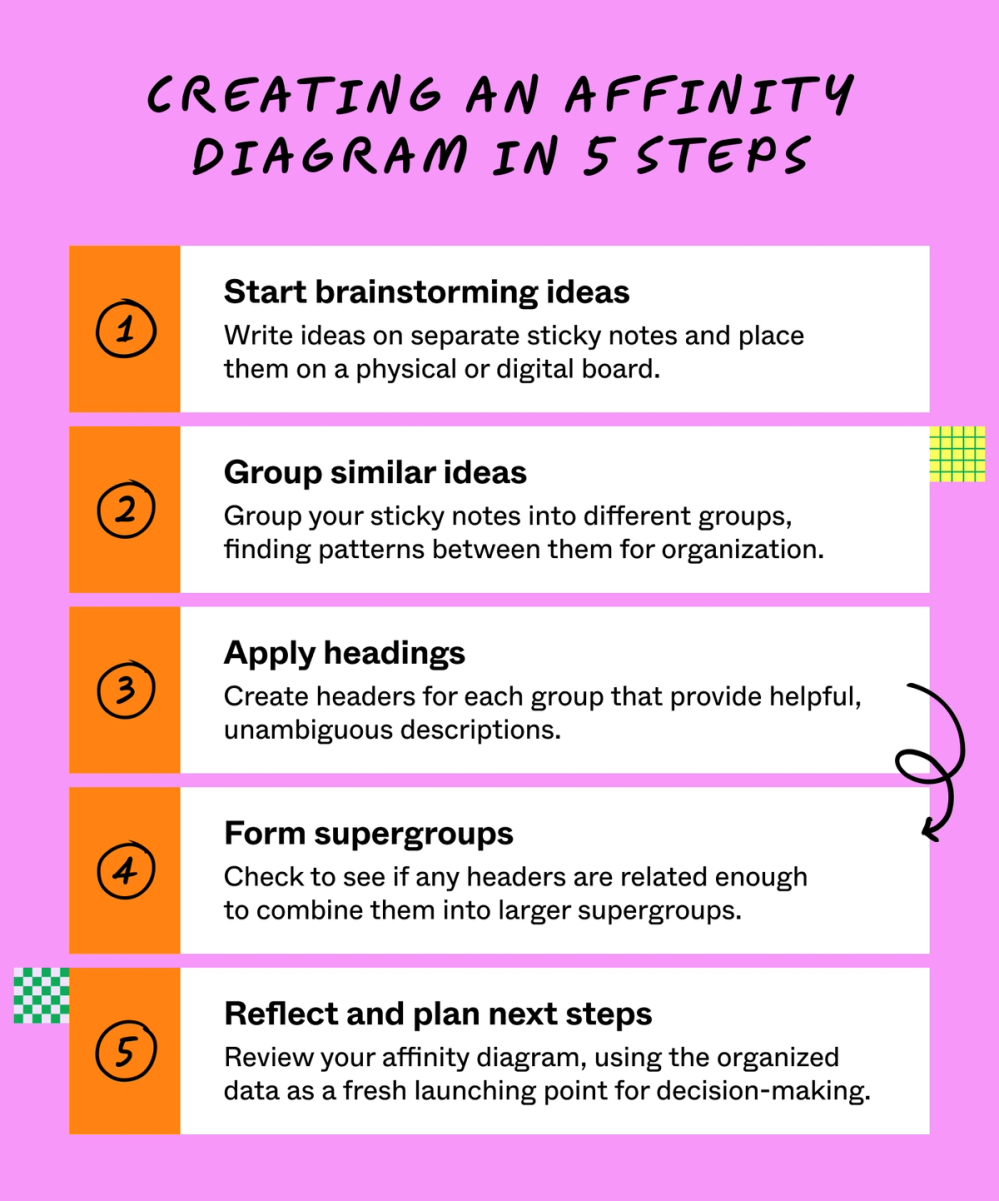
A structured approach helps teams organize information thoroughly while capturing valuable insights. Here are the five steps to build your affinity diagram:
Step 1: Start brainstorming ideas
Write down each idea or piece of data on a separate sticky note or card and stick it on a physical or digital whiteboard. This lets you clearly outline your thoughts, creating a set focus when generating ideas. As you brainstorm, feel free to use other techniques to generate ideas, such as mind mapping or lotus diagramming.
To get the ideas flowing, review qualitative data you’ve collected from surveys, user interviews, and other UX research. Consider interviewing stakeholders involved in the project to gather a broader range of perspectives and ideas.
Step 2: Group similar ideas
Look for relationships between individual ideas to come up with related groupings. Work silently at first and focus on finding and grouping ideas with common themes. You may find some “loners,” or ideas that don’t fit into a group. This is normal at the grouping stage.
You can open your affinity diagram to a broader group discussion to refine your categories and ensure everyone is on the same page.
Step 3: Apply headings
Create clear, self-explanatory headers for each group. Invite team members or stakeholders to discuss any surprising patterns and debate where controversial notes or loners belong. On each header card, briefly summarize each category.
As you create headers, try to keep titles simple enough that anyone can understand the category at a glance.
Step 4: Form supergroups
If you spot recurring themes across categories, merge them into larger categories called supergroups. Organize related groups into columns under a super header to identify overarching themes, recurring pain points, and key insights.
Step 5: Reflect and plan next steps
Once you’ve organized your affinity diagram, add your problem statement at the top, then extract insights for your next steps. Review themes and groupings, and title each category and supergroup. Discuss how patterns connect to user research and inform your future actions.
Benefits of affinity diagrams
Affinity diagrams transform scattered ideas into clear action plans, bringing structure to real-time brainstorming sessions. They help teams:
- Synthesize information. By grouping ideas, you can identify patterns, helping others understand complex data.
- Enhance team collaboration. Diagramming encourages collaboration and helps aid higher levels of communication while highlighting perspectives.
- Improve decision-making. Structuring data helps teams identify themes and prioritize their thought process.
- Promote creativity. Diagramming can spark new insights, leading to creative solutions that may have been otherwise concealed.
Affinity diagram examples for designers
Whether you’re a designer, product manager, or UX design researcher, affinity diagrams can help you synthesize and reconcile feedback. Here are common scenarios where affinity diagrams drive results:

Situation 1: Complex problems
Affinity diagrams collect ideas, data, and opinions from team members to help you find new approaches to complex issues.
Example: Let’s say you need to design an app or website. Affinity diagramming allows you to easily group design aspects into categories, such as usability, visual design, content, and technical issues.
Situation 2: User research
An affinity diagram organizes raw data into common themes and key insights you can use for interviews, surveys, and usability tests.
Example: If your team designs a UX for a new app, use affinity diagramming to sort user feedback into categories, like security concerns, ease of use, and functionality needs.
Situation 3: Project planning
Use affinity diagrams for project management to group tasks, assign roles, and prioritize activities.
Example: Sort design project tasks into categories like research and discovery, design and prototyping, and development and testing.
Situation 4: Product innovation
Product and design teams use affinity diagrams to map the design thinking process and development priorities.
Example: Sort user needs, rank design ideas, and prioritize product features for user-centered design.
Ace affinity diagramming with FigJam
Affinity diagrams allow designers and other creatives to organize their thoughts, highlighting what’s most important within a big-picture view. Even better, affinity diagram templates help you turn abstract ideas into actionable ones to get your project off the ground. Here’s how FigJam can help:
- Jump right into ideation with a brainstorming template that helps you organize your thoughts.
- Learn how to kick off a brainstorming session with templates from the Figma Community.
- When you’re ready to implement ideas, use Figma’s strategic planning templates to give your team the necessary direction.
Ready to start brainstorming with affinity diagrams?