What is a context diagram? And how to create one (+ examples)


Share What is a context diagram? And how to create one (+ examples)
Explore more from
Team productivity

Are you mapping out a wireframe for a new website? Improving an existing app? For big, multi-layered projects like these, it’s easy to get lost in the details.
This is when context diagrams shine. Context diagrams help you see how information flows through a system, turning sprawling project briefs into clear, high-level snapshots.
In this post, you’ll find out:
- What a context diagram is and how to effortlessly create one
- Practical examples of effective context diagrams
- Best practices and tips for getting the most out of these diagrams
What is a context diagram?
A context diagram is a simple visual representation that maps out how information moves within a system. That system might be anything from a software application to a business workflow—any interconnected set of activities, inputs, and outputs.
The goal? Simplify complexity. These diagrams give stakeholders a clear view of a system’s scope and external connections, even if they’re not deep in the technical weeds. They’re especially useful for roles like product managers, business analysts, or cross-functional collaborators, who need a high-level understanding without diving into code or workflows.
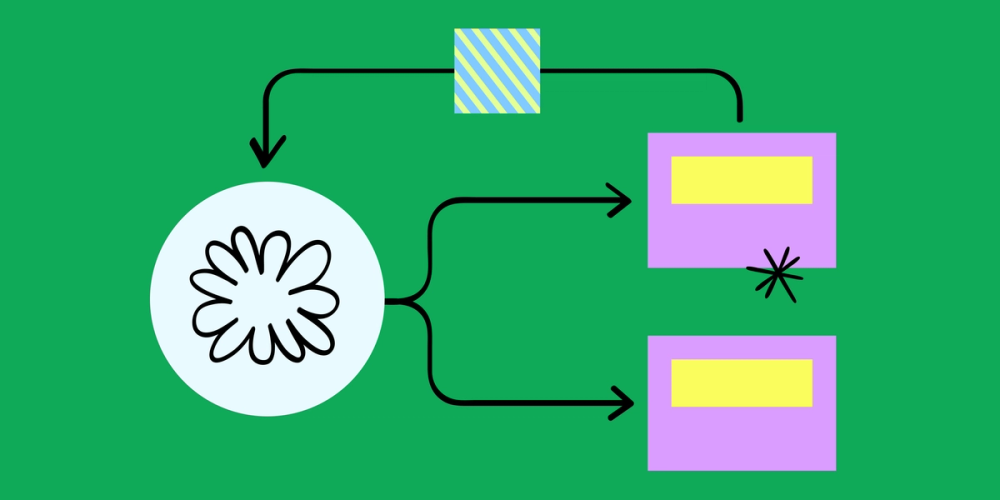
Key components of context diagrams

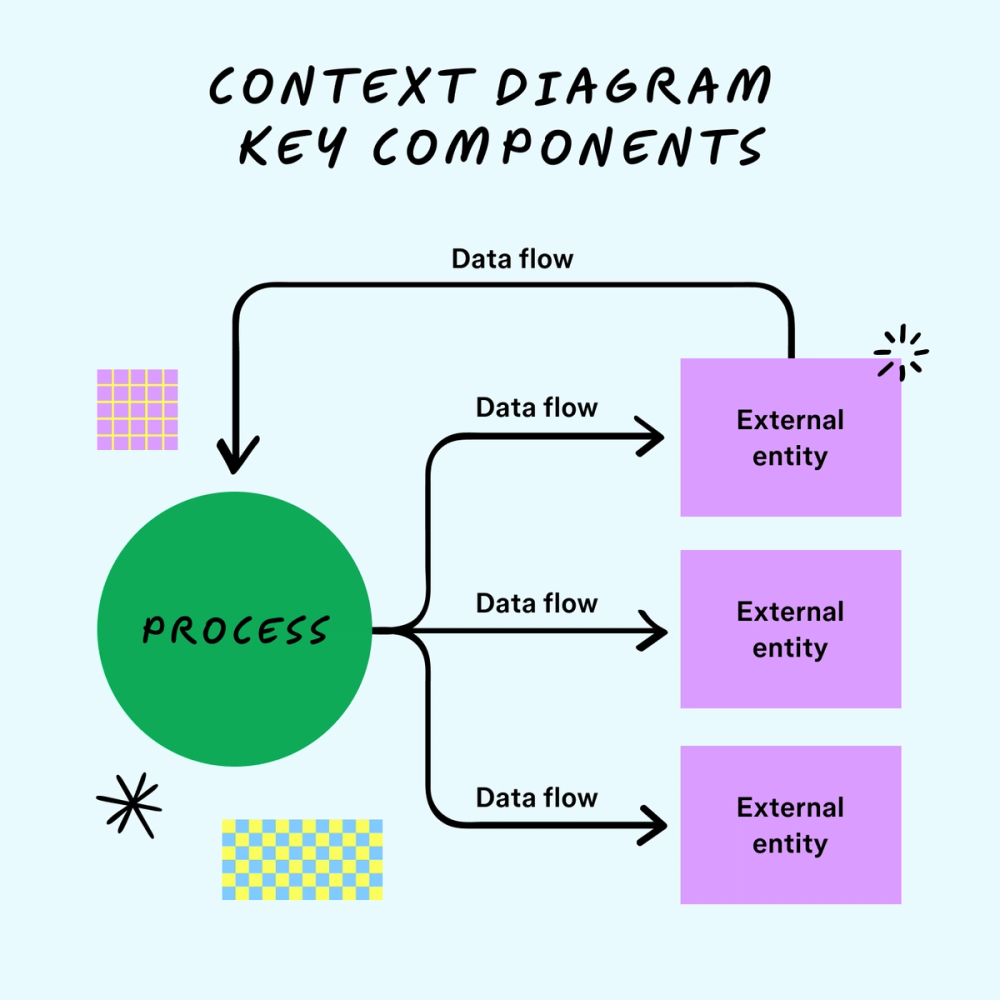
Every context diagram includes three main parts:
- Process: The system’s central function (e.g., an app, feature, or platform).
- External entities: People, teams, or tools that interact with the system.
- Data flow: Arrows showing how information moves between the system and external entities, labeled to describe the data exchanged.
Benefits of using a context diagram
Context diagrams helps teams and stakeholders
- Understand complex systems at a glance
- Communicate without using technical jargon
- Align across roles and foster better team communication
- Set a foundation for scalable, structured design systems
They also boost early-stage collaboration and reduce the risk of misalignment or misunderstandings deep into the development process.
How to create a context diagram in five steps
Follow these steps to create a context diagram:
Step 1: Select the process
Start by identifying the system’s main function—what’s at the heart of it? This becomes the central element of your diagram, typically drawn as a circle. This is the central part of your context diagram.
Step 2: Identify external entities
Determine who or what external entities, like users, other systems, or data sources outside the system. List everyone and everything outside the system that interacts with it. This might include customers, suppliers, or external systems. Then sketch out these entities around your main process.
Step 3: Map out data flow
Determine the information exchange between the process and external entities. Think about the inputs and the outputs it generates for external entities, using flowchart symbols to map out ideas.
For example, arrows represent data direction, pointing from the source (external entity) to the destination (process) or vice versa. Label them with the data type exchanged (e.g., user input, API data, confirmations).
This step helps illustrate how information moves between the process and external entities, representing data flow in your context diagram.
Step 4: Create the diagram
Now that you’ve determined the process, external entities, and data flow, bring it all together visually:
- Use a circle in the center to represent the core process.
- Add the external entities you identified around it.
- Use arrows between them to show how data flows.
- Label each arrow with the type of information exchanged.
- Optionally, draw a boundary around the system to clarify what is internal and external.
Keep it simple and high-level. Leave out specifics like user permissions or backend logic. Focus on relationships, not technical depth.
Present your context diagram with Figma Slides
Gather context diagram feedback through engaging and interactive presentations with Figma Slides.
Step 5: Review and refine
Share your context diagram with your team or stakeholders to identify discrepancies or areas for improvement. Look for:
- Missing entities or data exchanges
- Confusing or redundant flows
- Changes to the system that aren’t reflected
Revisit and refine the diagram to keep the diagram up to date.
System context diagram examples
Let’s look at some examples of when to use context diagrams and what they might look like.
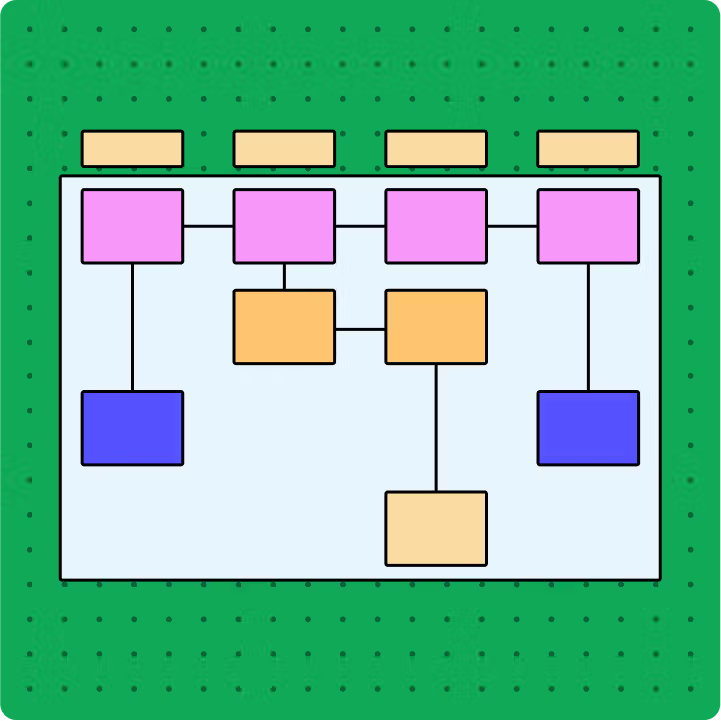
Example 1: Resource allocation

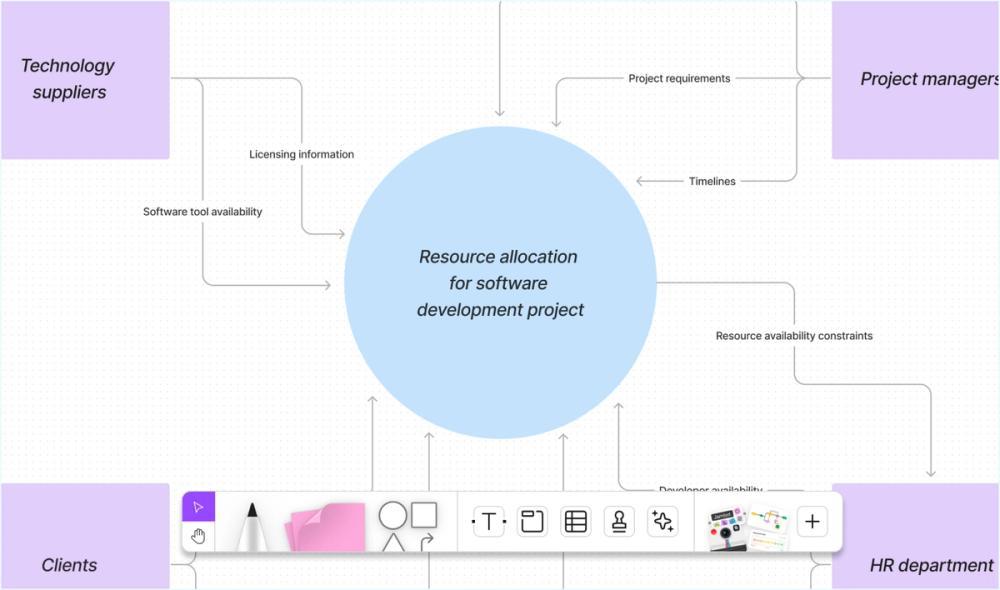
Context diagrams can display how a project uses resources like people, equipment, and materials. By illustrating how these elements connect to different tasks and teams, project managers can divide them and ensure the necessary resources are ready when needed.
Example 2: Risk assessment

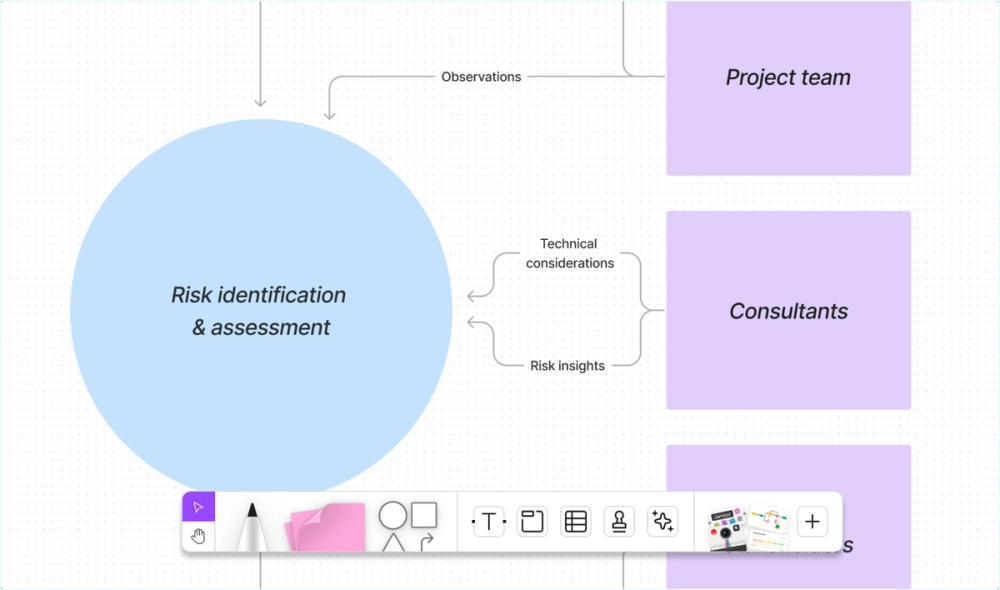
Context diagrams help find and understand project risks. They help determine how different parts of the project and outside factors connect. This can help you spot possible risks and their origins.
Example 3: Project reporting

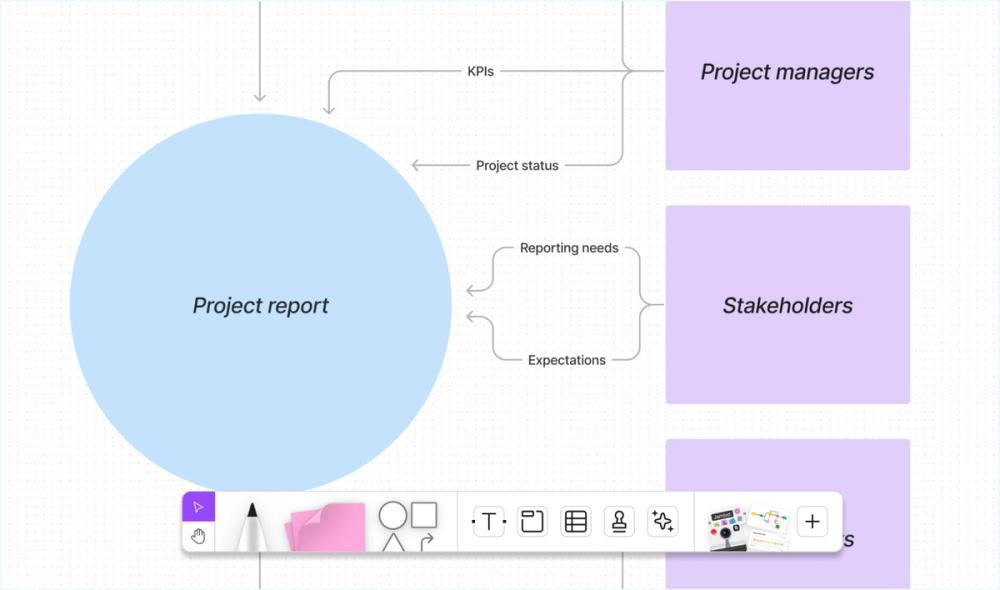
Context diagrams show the relationships between project goals, key performance indicators (KPIs), and project stakeholders. This helps project reporting by showing progress, project status, and performance against goals.
Best practices for using context diagrams
Consider the following best practices when using context diagrams.
Look for integrations
Use context diagrams at the start of a project to align systems, identify dependencies, and prevent integration surprises later.
Make it collaborative
Co-create diagrams with your team. Tools like the FigJam context diagram template make it easy to build, comment on, and revise together in real time or async.
Keep it current
As projects evolve, so should context diagrams. Revisit and update regularly to keep them a reliable reference
Avoid common pitfalls
Keep an eye out for common pitfalls, like getting tangled up in unnecessary details. Stay focused on the big-picture interactions and keep your team involved every step of the way.
Here are a few examples of common mistakes when creating context diagrams:
- Including too much detail
- Omitting key users or systems
- Failing to update the diagram as projects evolve
- Skipping stakeholder feedback
Context diagrams vs. data flow diagrams


While context diagrams offer a high-level overview of a system’s structure and information architecture, data flow diagrams (DFDs) delve deeper into the internal operations and detailed data movement.
Context diagrams are a great starting point for understanding a system's structure. They highlight each process and illustrate how information moves from one step to the next without revealing specific features.
DFDs, structured across multiple levels, provide a granular analysis of system processes, enabling a comprehensive breakdown of how each part functions within the whole.
For example, level 1 DFDs examine one part of the whole system and provide details about that specific part. Level 2 DFDs show how the entire system works, providing details of its operations and functions.
Enhance project management and collaboration with FigJam
Context diagrams are invaluable tools for simplifying complex systems and providing a comprehensive view that lays out operational dynamics and simplifies development phases for non-technical stakeholders. Here’s how Figma can help your team take advantage:
- Encourage more productive collaboration with FigJam’s collaborative online whiteboard.
- Explain your findings and share your context diagram through engaging, interactive presentations with Figma Slides.
- Demonstrate ideas in a flash with AI-generated functional prototypes.
Design your next context diagram with FigJam
Ready to start diagramming?
Keep reading

What is sprint planning?
Find out how to plan sprints effectively with a step-by-step guide, pro tips, and tricks from FigJam.


10 steps to the perfect project kickoff meeting
Learn how to bring teams and stakeholders together to align expectations at the start of a project.

What is a lotus diagram?
Brainstorming sessions feeling scattered? Find clarity within the chaos.