What is a network diagram?


Share What is a network diagram?
Explore more from
Team productivity


Ever wondered how to map your computer network? If so, a computer network diagram is your go-to tool for mapping devices, software, and connections. In this post, we'll focus on computer network diagrams, covering:
- What a network diagram is
- Types of network diagrams
- Network diagram examples
- How to create your own network diagram with the FigJam template
What is a network diagram?
A network diagram is a visual representation of your computer or telecommunications networks. These diagrams are also referred to as computer network diagrams.
The diagram focuses on components and connections within a network. These connections form between linked devices, data, and interaction points called nodes.
Network diagrams are helpful for IT professionals and administrators. They are important because they provide a visual representation of network infrastructure, which helps people understand, manage, and troubleshoot complicated networks.
Think of these diagrams like flow charts that illustrate your computer network. They use symbols and icons to represent each node and its purpose. Teams use these diagrams to:
- Send network information to vendors, partners, and other third parties
- Ensure a network complies with PCI DSS and other compliance standards
- Troubleshoot and catch errors in your network
- Update an office network to meet new requirements
Types of network diagrams
Not all network diagrams focus on the same kinds of information. Here are the three main categories of computer network diagrams:
- Basic network diagram: A simplified view of the way information moves through your devices and network processes. For example, this type of network diagram would be helpful in providing new employees with a simplified understanding of network processes.
- Physical network diagram: The arrangement of hardware making up a network. For example, this diagram helps in visualizing hardware arrangements for infrastructure upgrades.
- Logical network diagram: How information flows through a network. For example, this diagram can help optimize network architecture by illustrating how data flows through the network.
What is a network topology?
A network topology is a diagram of how a computer network is set up and often organizes network parts into shapes. It shows how devices are connected and work together in a network. Here are the most common network topology shapes:

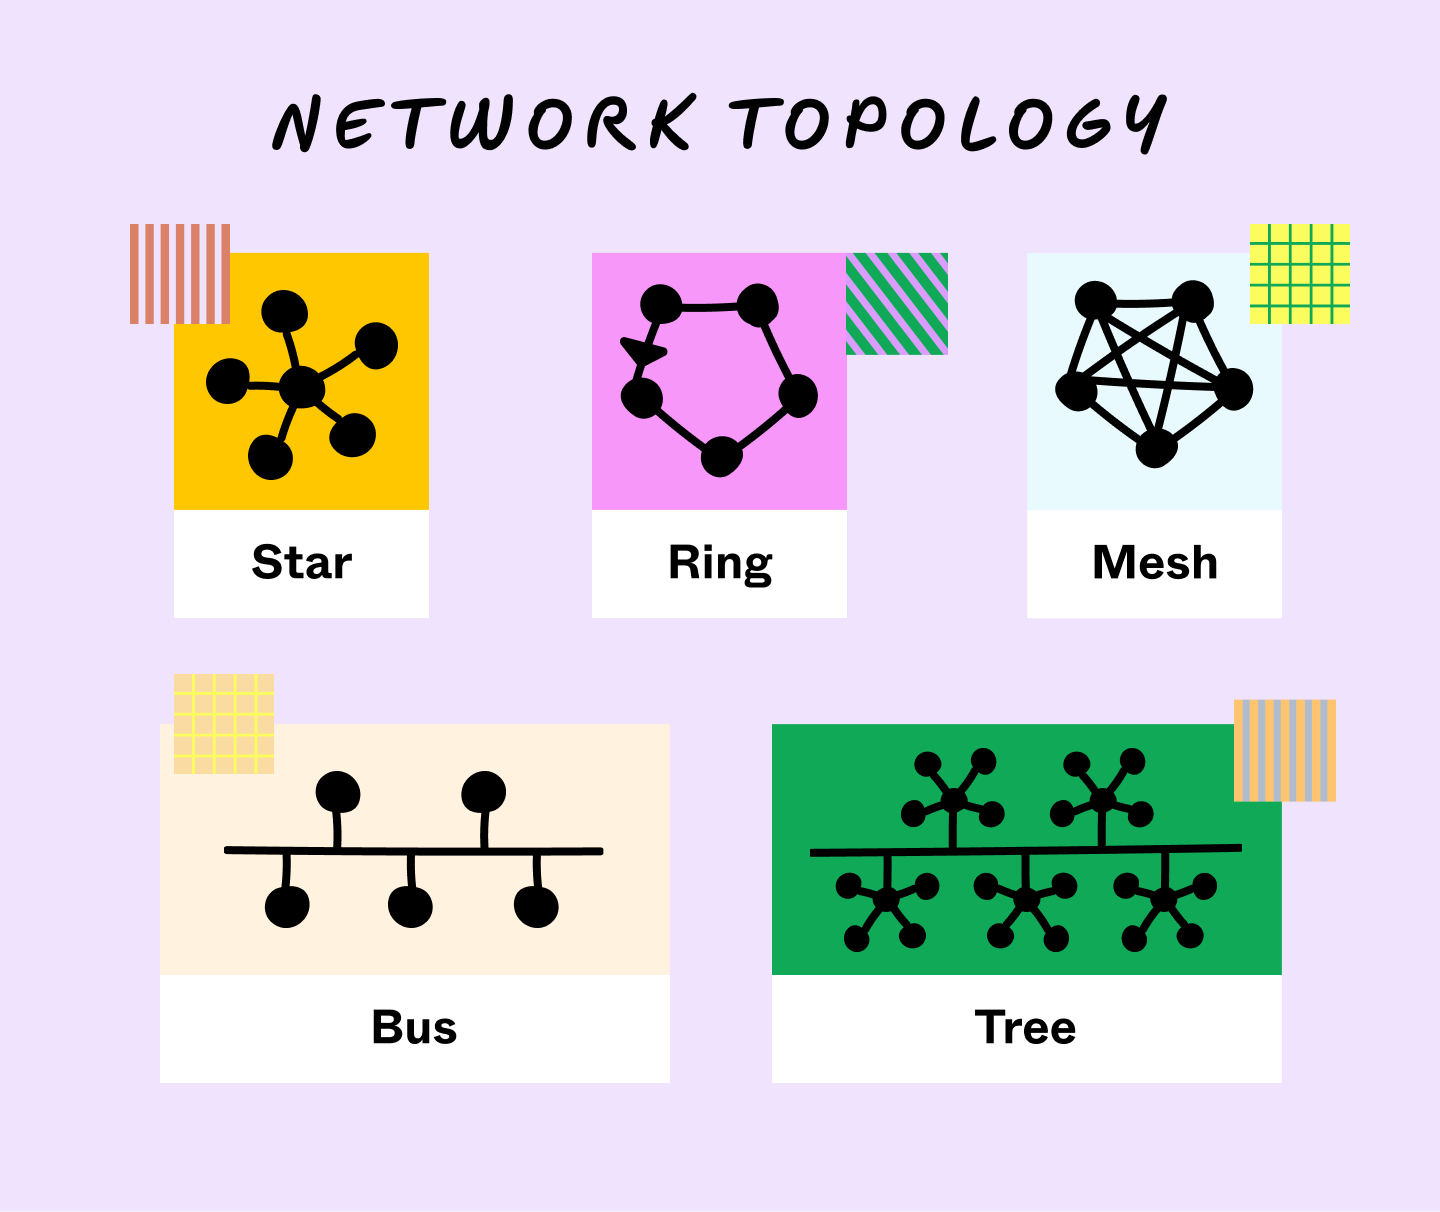
- Bus topology organizes all devices along a central cable, called a bus, with an endpoint on each side. Because of its simple layout, this topology is perfect for smaller networks. However, if there are issues with the bus, the entire network can break down.
- Star topology connects surrounding nodes to a central hub, node, or switch all data passes through. This topology is great for scaling businesses since you can easily add a new device to the central hub.
- Mesh topology comes in full and partial varieties. In a full mesh, every node connects to every other node. In a partial mesh, nodes only connect with those they interact with the most. Mesh networks avoid central weak points but cost more to install and maintain.
- Ring topology uses circular patterns, sending data around a ring until it reaches its destination. The ring shape offers reliable, low-cost performance and customization. However, because all data must pass through every node along the ring, this configuration can be slower than a star topology.
Many networks combine parts of these structures into hybrid topologies. For example, one of the most common hybrid topologies is a tree topology. It combines a star and bus topology to arrange elements like branches on a tree. They create strict pathways between nodes above or below each other on the hierarchy. So, if one node fails, only the nodes below it fail.
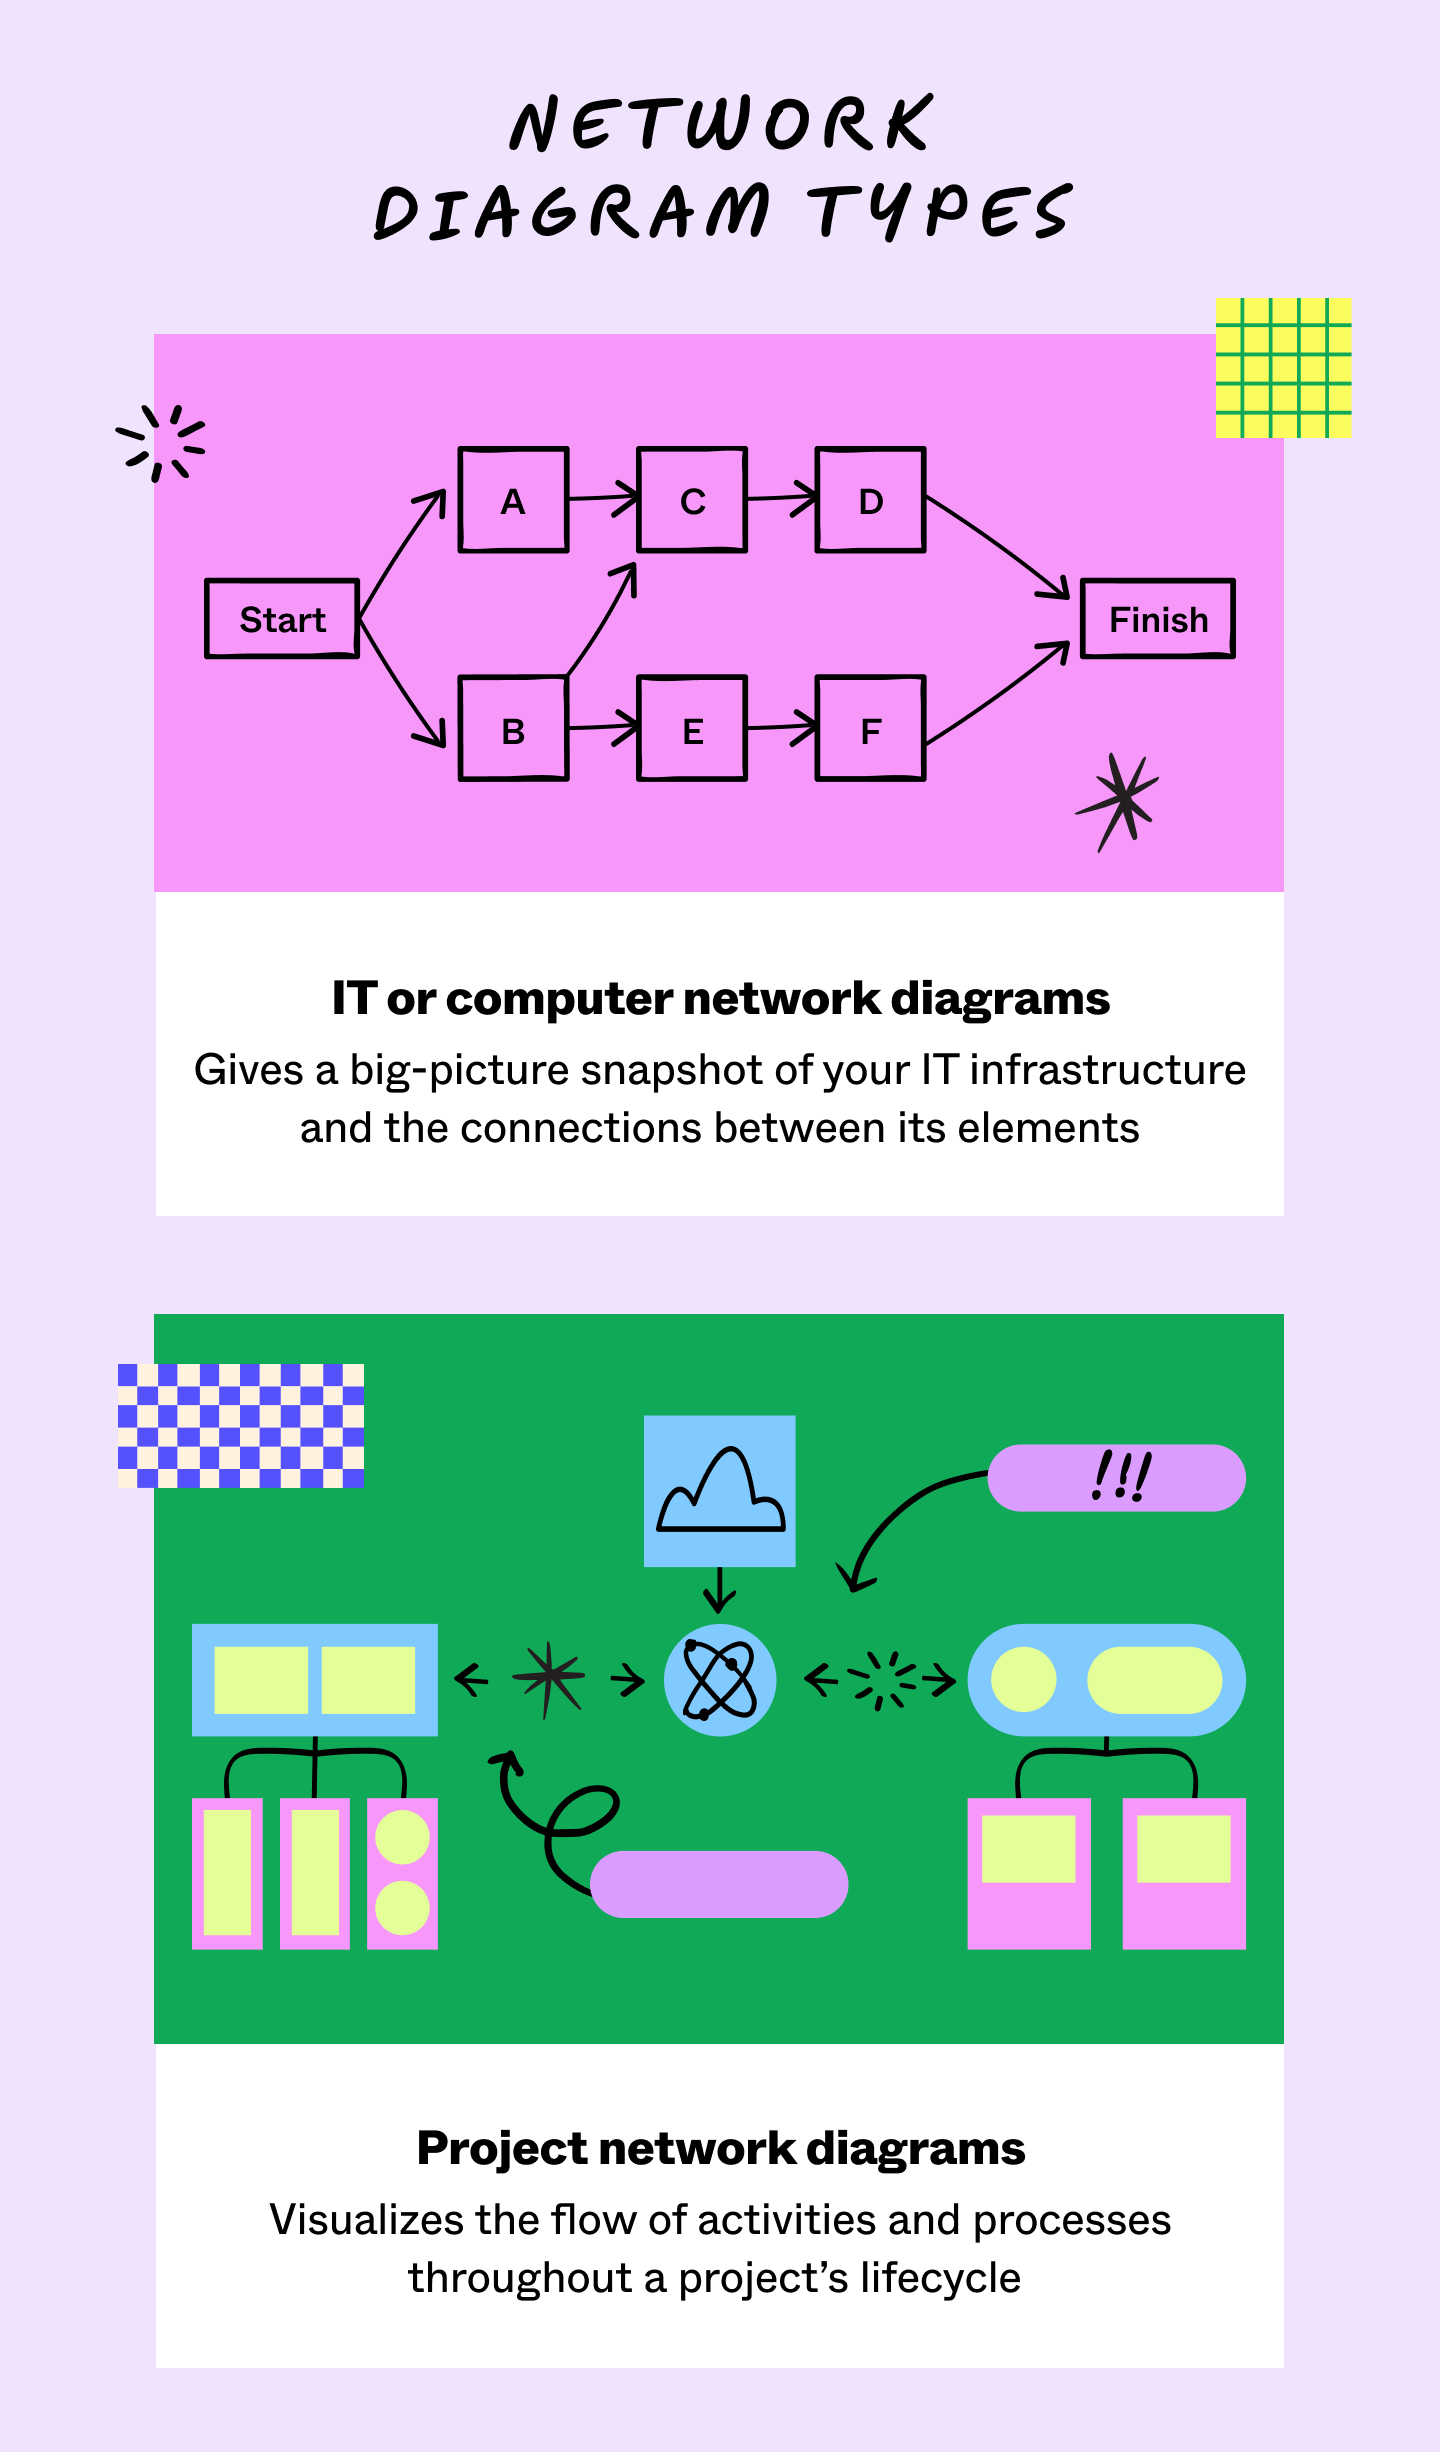
What is an activity network diagram?
Network diagrams aren't just helpful for IT infrastructure; the principles can apply to any project. Network diagrams for project managers, or activity network diagrams, show the tasks within a project.
Like IT network diagrams, they highlight the connections between components. That said, project network diagrams show how processes flow with labeled boxes and arrows instead of icons.
Project network diagrams keep tabs on every moving part of a project. This vantage helps project managers:
- Highlight the duration of tasks and their dependencies
- Map processes around the data they draw from or share
- Track teams’ progress through every project step
- Explain progress to stakeholders and product owners
- Estimate a project’s scope based on the number of activities
- Identify potential bottlenecks
- Improve information architecture by creating a single source of truth on workflows

Network diagram icons
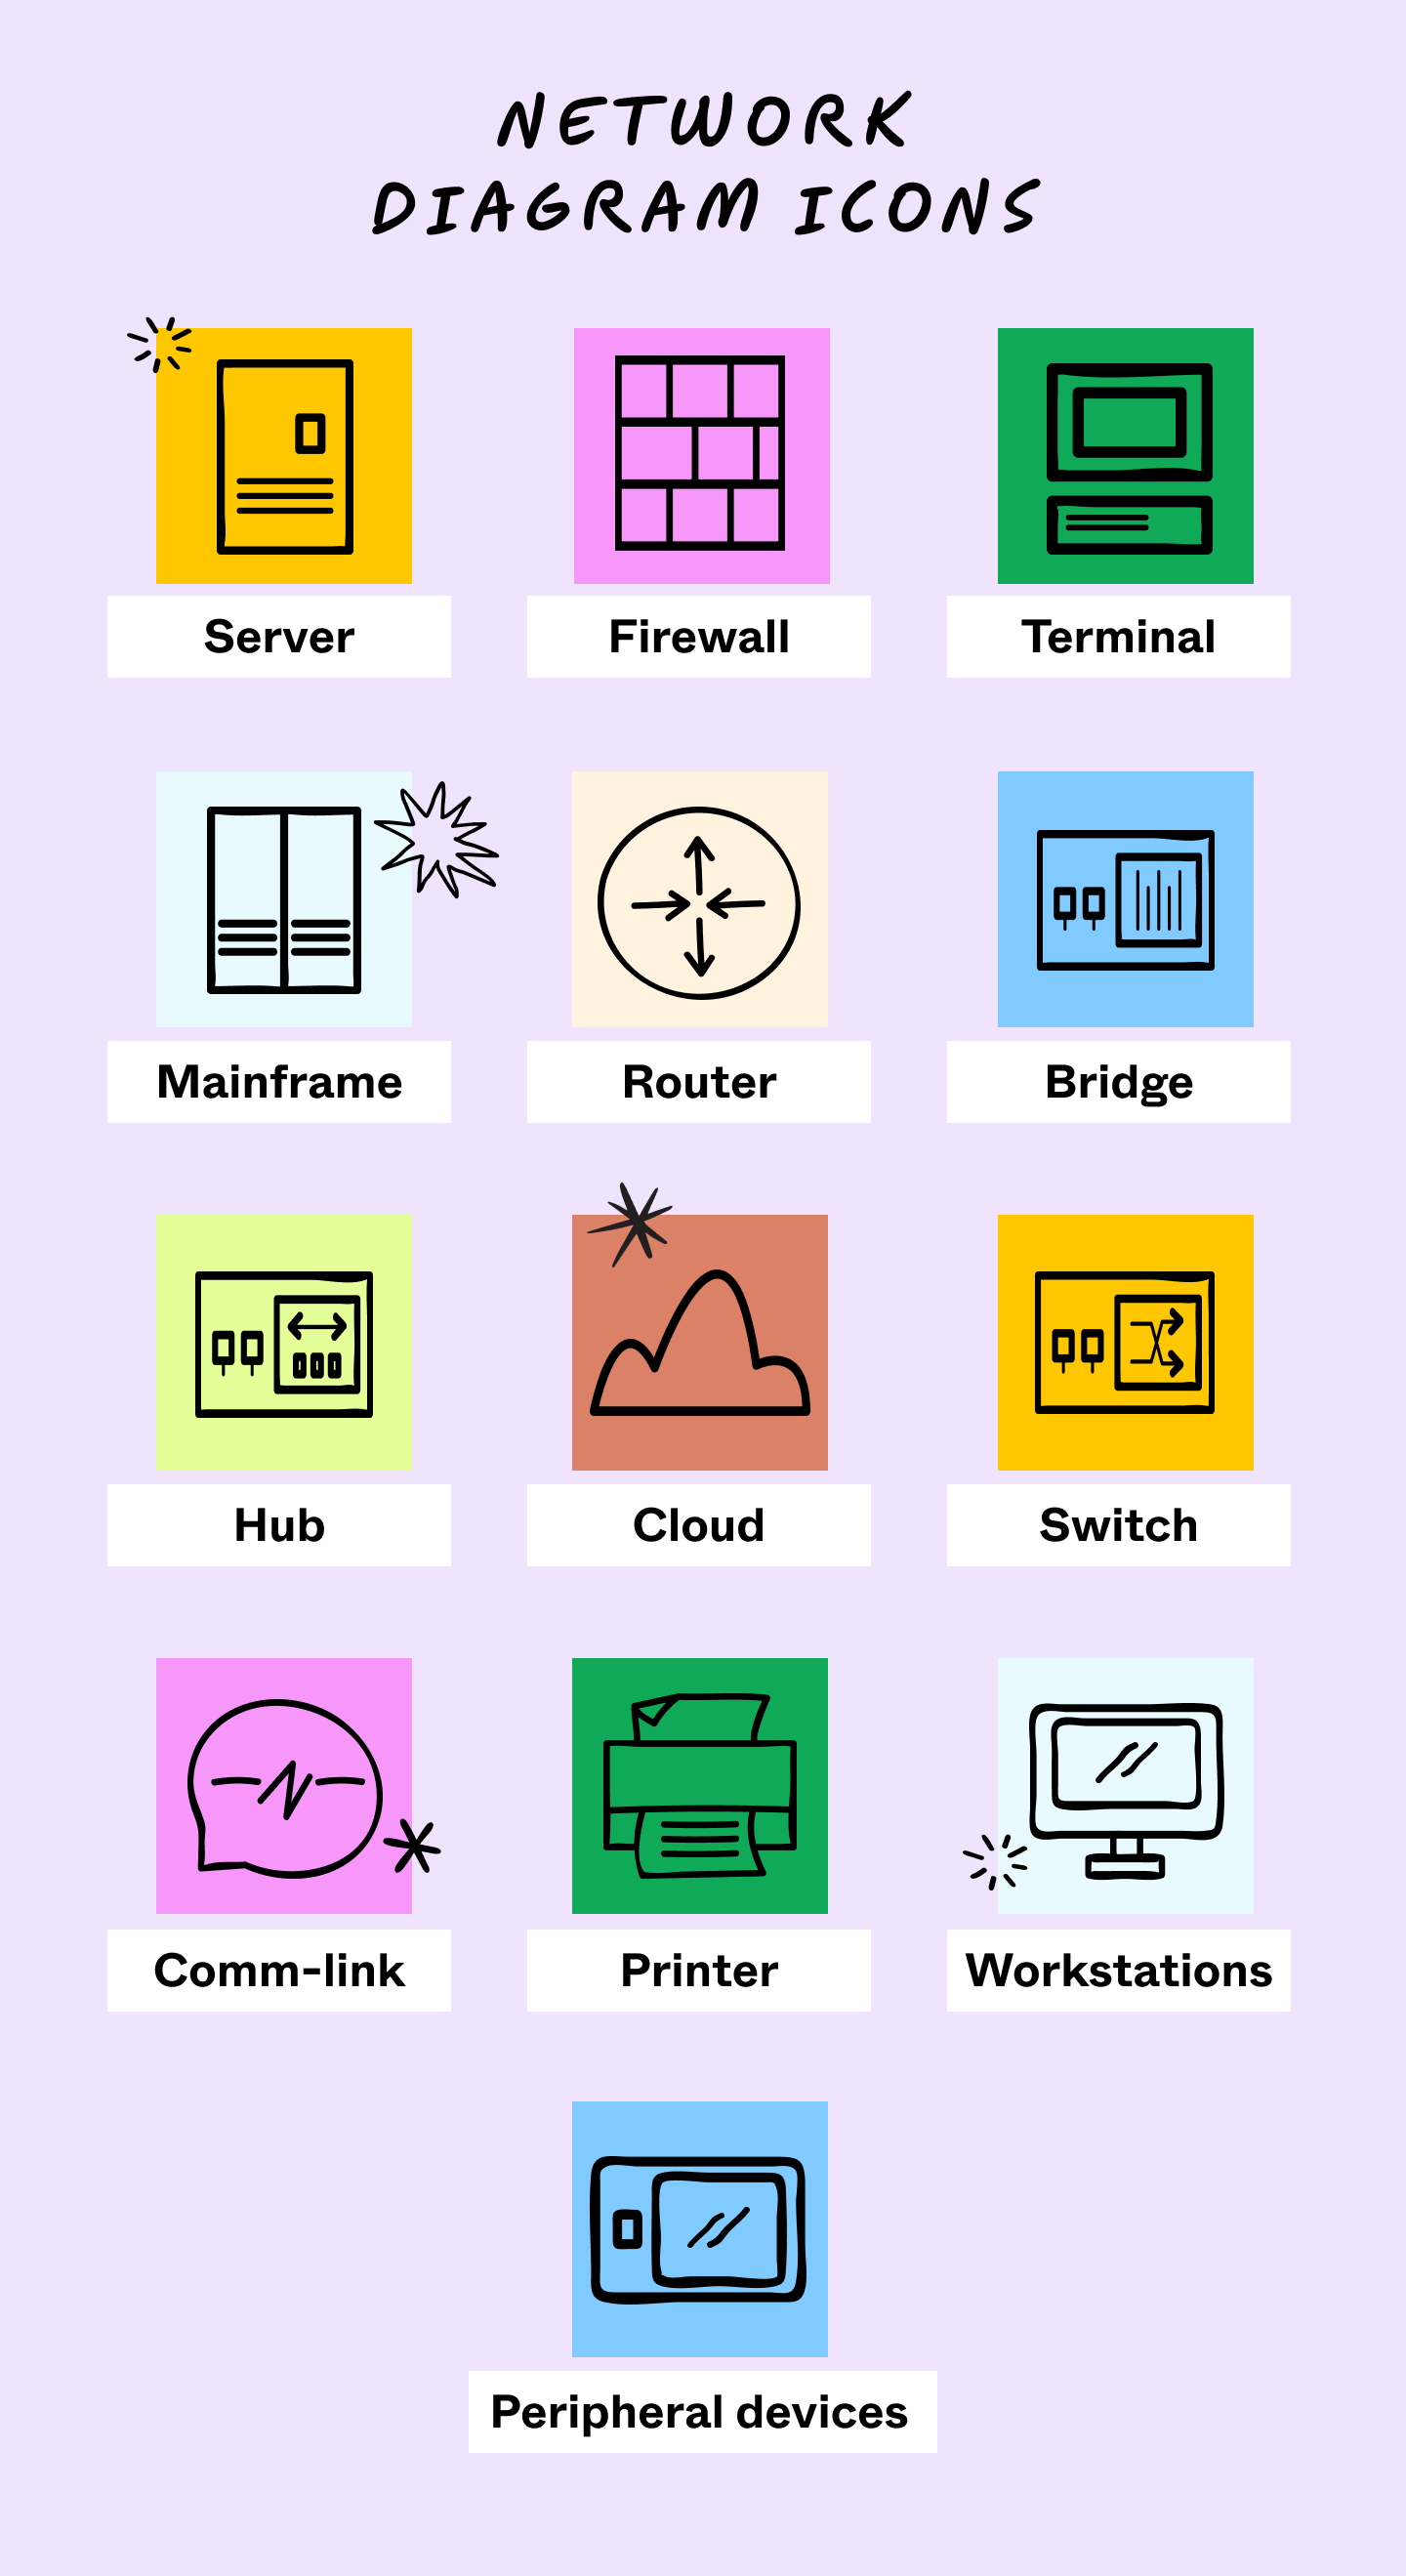
Network diagrams use symbols and icons to represent your IT assets and processes. Here are the most common computer network diagram symbols:
- Server: Devices for storing programs, data, and resources in a network
- Firewall: A network security device that restricts and monitors network traffic
- Terminal: Hardware used to access data or leave a network
- Mainframe: High-performance devices that compute complex data
- Router: Devices that connect multiple networks
- Bridge: Hardware that connects local area networks (LAN)
- Hub: Devices linking computers together
- Cloud: A network of servers and programs that connect via cloud-based tools
- Switch: Tools allowing two devices to exchange data along network paths
- Comm-link: Physical or data links that form communication channels
- Printer: Printers connected to Ethernet or Wi-Fi networks
- Workstations: Computers designed for technical or organizational uses
- Peripheral devices: Devices that help users interact with a computer or influence the flow of information into and out of one

How to make a computer network diagram
Here’s how to build a computer network diagram in five steps.
1. Select a network
Pick a network or part of a network you want to focus on. Depending on the scale of your network, you may want to break your diagram into separate charts. This helps reduce confusion for your team and gives them an area to focus on. Even when two complex networks interact, keep them on separate diagrams for clarity.
2. Include the hardware
Hardware, devices, and workstations lay the foundation for your diagram. Before drawing connections, map the physical components of your network. FigJam’s network diagram template helps by letting you drag and drop premade icons for common tools like servers and firewalls.
3. Factor in software
Add in the different types of software you use with your hardware. Software includes tools like firewalls, IP managers, and network configuration systems. You can group icons on your diagram by placing software around the devices running it.
4. Draw connections
Draw connections between your network elements. Lines between icons denote the flow of information or their part in a shared process. You can make these connections between devices, software, or both. You can also add arrows to the lines between nodes to clarify the flow of information.
5. Revise your diagram
Even if you’re proud of the first draft, extra formatting will help refine it. Start by labeling objects and connections to explain what they do or how they work. You can also number these connections to note dependencies or the sequence of tasks. Finally, color-coding your software and hardware will make them more distinct.
Network diagram example and template
In this example diagram, each icon stands in for a node, and lines represent their connections. Hardware, such as workstations, and software, like firewalls, share data for network processes. Icons like the switch and router represent network connecting devices.

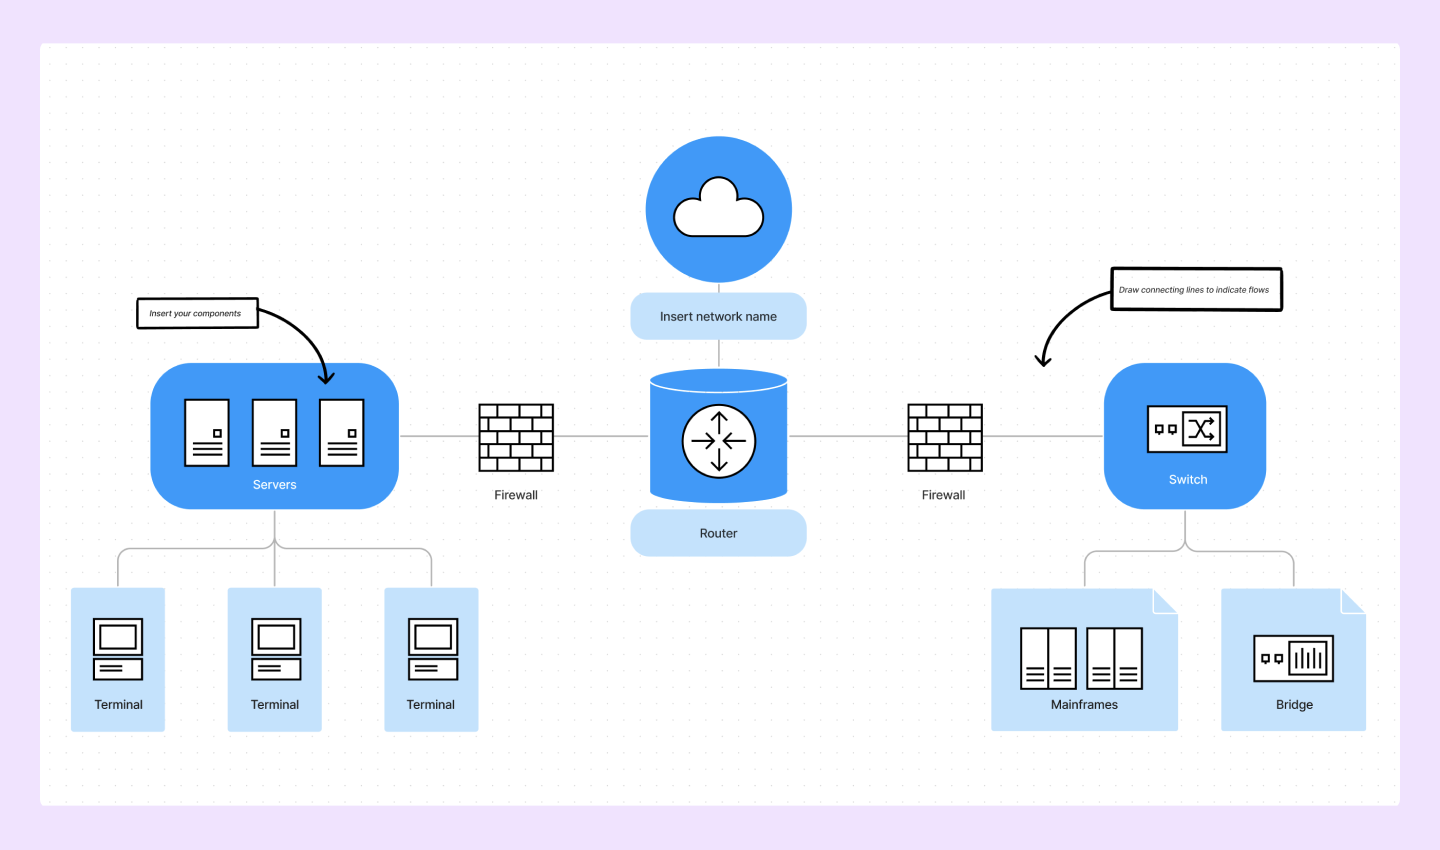
Ready to start diagramming? Try our network diagram template.
Optimize your workflows with FigJam's network diagram template
If you want to start network diagramming or find ways to streamline your processes, FigJam can help. With FigJam, your teams can collaborate, share feedback, and design new approaches together. You can:
- Map out your network with ready-made icons, shapes, and the text tool
- Lead brainstorming sessions to find network improvements
- Share in-progress diagrams with your team to collect feedback
Ready to begin diagramming? Try FigJam to get started.