What is an entity relationship (ER) diagram?


Share What is an entity relationship (ER) diagram?
Explore more from
Team productivity

Think back to the last time your team had a brainstorming session. Did the whiteboard eventually turn into a mess of scribbles? Did you struggle to demonstrate how different pieces fit together for the final vision?
Misunderstandings about data relationships can derail a project before it even gets off the ground, wasting time and money. But what if there was a visual tool to bridge the gap? That’s where entity relationship diagrams (ERDs) come in.
ER diagrams serve as guides to connect the dots between data points, helping you design better systems. With a few simple shapes and lines, you can transform complexity into clarity, ensuring your project is built on a solid foundation of understanding.
So what is an ER diagram and how can it work for you? Read on to find out:
- Why ER diagrams matter
- Key components and symbols of an ER diagram
- How to create an ER diagram in five steps
ER diagram definition
An ER diagram (also known as an entity relationship diagram, entity relationship model, or ER model) is a conceptual data model or schema showing how entities interact. A strong ERD is the backbone of a modern information system, providing clear data flow diagrams any computer can follow to execute key business processes.
ERDs follow a simple, logical structure so everyone involved in designing or retooling an information system can easily grasp how it works. Product team members can use ER diagrams to get up to speed faster and quickly refine database structure.
ER diagrams help you map out key business processes, whether you’re designing new products with complex database models or upgrading old information systems. You’ll quickly see how different entities connect, linking users, data, and product components.
ER diagrams are useful in situations where teams need to design or improve database structures. Some examples include:
- Mapping user data flow
- Clarifying what developers want from designers by visualizing the relationships between data elements
- Uncovering potential inconsistencies, redundancies, or missing information early in the design process
- Building or restructuring relational databases for applications like inventory systems, customer relationship management (CRM) tools, or content management systems (CMSes)
Whether you’re creating a new product or optimizing an existing system, ER diagrams serve as a foundational tool for clear communication and efficient system design. Even if you don’t have an ER model in place for an existing database, it’s not too late to start.

Key components of ER diagrams
Remember sentence diagramming from elementary school? If you think of entities as nouns and relationships as verbs, ER diagrams are similar to grammatical sentence structure.
Entities
An entity is a real-world object, person, or concept with stored information. Examples include a customer, employee, order, or product. Entities are represented by rectangles in an ER diagram and can be grouped into specific types and sets.
Your entity set might include users, product components, and data your information systems store. If you’re creating a database design to store creative assets, your different entities might include a range of media files (digital photos, graphics, videos, etc.).
An entity that does not depend on others in your schema is a strong entity (usually captured in a rectangle) while an entity that cannot be uniquely identified by its own attributes and must depend on a foreign key from another entity, known as the “parent” or “owner,” is a weak entity (captured in a double rectangle). For instance, imagine a hotel database with a weak entity of “Bed.” A bed can’t be appropriately identified without knowing which hotel “Room” it’s in, so it needs the foreign key “Room Number” (from the “Room” entity) for its complete primary key.
Relationships
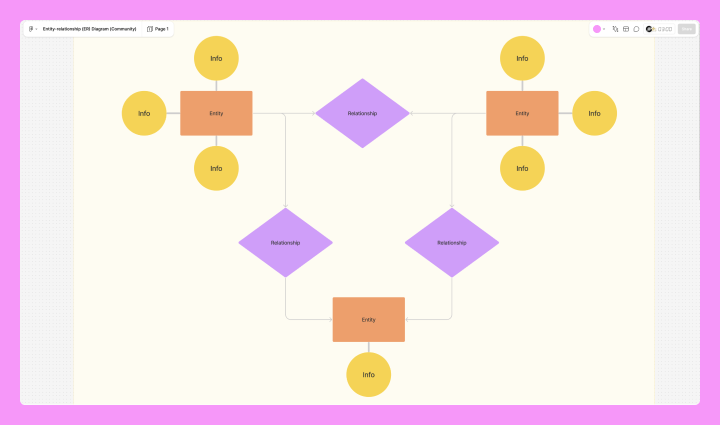
Relationships refer to the contexts and connections that exist between the entities. On an ER diagram, they are shown by connecting lines and diamond-shaped labels. Put simply, lines show which entities are involved, while diamonds explain how they are connected.
Relationships define how entities interact with or connect to one another. For example, in a retail database, a “Customer” entity might be related to an “Order” entity through a “Purchase” relationship.
Attributes
An attribute describes a characteristic of an entity in an ER diagram, depicted by oval shapes. To bring it back to the grammar simile, an attribute is like an adjective.
For example, a “Customer” entity’s attributes might include customerID, name, address, and phone number, while a “Product” entity might have attributes like productID, name, and price.
There are different types of attributes:
- Simple attributes: indivisible values, like a customer’s first name or phone number
- Composite attributes: have more than one component and can be broken down into smaller parts, such as an “Address” attribute split into “Street,” “City,” and “ZIP Code” fields
- Derived attributes: calculated or inferred from other attributes, like how “Age” can be derived from “Date of Birth”
- Multi-valued attributes: represented by a double oval, these are attributes with multiple values, like a customer having their home phone number and mobile phone number listed under the “Phone Number” field
When discussing attributes in ER diagrams, it’s also important to understand keys:
- Super key: a set of one or more attributes that uniquely identify a record in an entity
- Candidate key: a minimal super key with no unnecessary attributes
- Primary key: a specific candidate key chosen to uniquely identify records in a table—for example, “CustomerID” could serve as the primary key for a “Customer” entity
- Foreign key: an attribute in one entity that references the primary key of another entity to establish a relationship, such as the “CustomerID” attribute in an “Order” entity referencing the “Customer” entity
These attribute types and keys ensure all data in a database is well-structured, interlinked, consistent, and uniquely identifiable.
Cardinality
In an ER diagram, relationship cardinality defines the number of instances of one entity that can be associated with instances of another entity.
There are a few different types of relationship cardinalities:
- One-to-one (1:1): A one-to-one relationship is when a single instance of one entity is associated with a single instance of another entity. For example, in a database tracking employees and their company-assigned vehicles, each employee might be linked to only one company car, and each company car is assigned to only one employee.
- One-to-many (1:M): In a one-to-many relationship, a single instance of one entity can be associated with multiple instances of another entity. For example, a “Customer” entity might have a one-to-many relationship with an “Orders” entity because one customer can place multiple orders, but each order is tied to only one customer. This is one of the most common relationship types in relational databases.
- Many-to-many (M:M): In a many-to-many relationship, multiple instances of one entity are associated with multiple instances of another entity. For example, in a university’s database, “Students” might have a many-to-many relationship with “courses” because students can enroll in multiple courses, and each course will have multiple enrolled students.

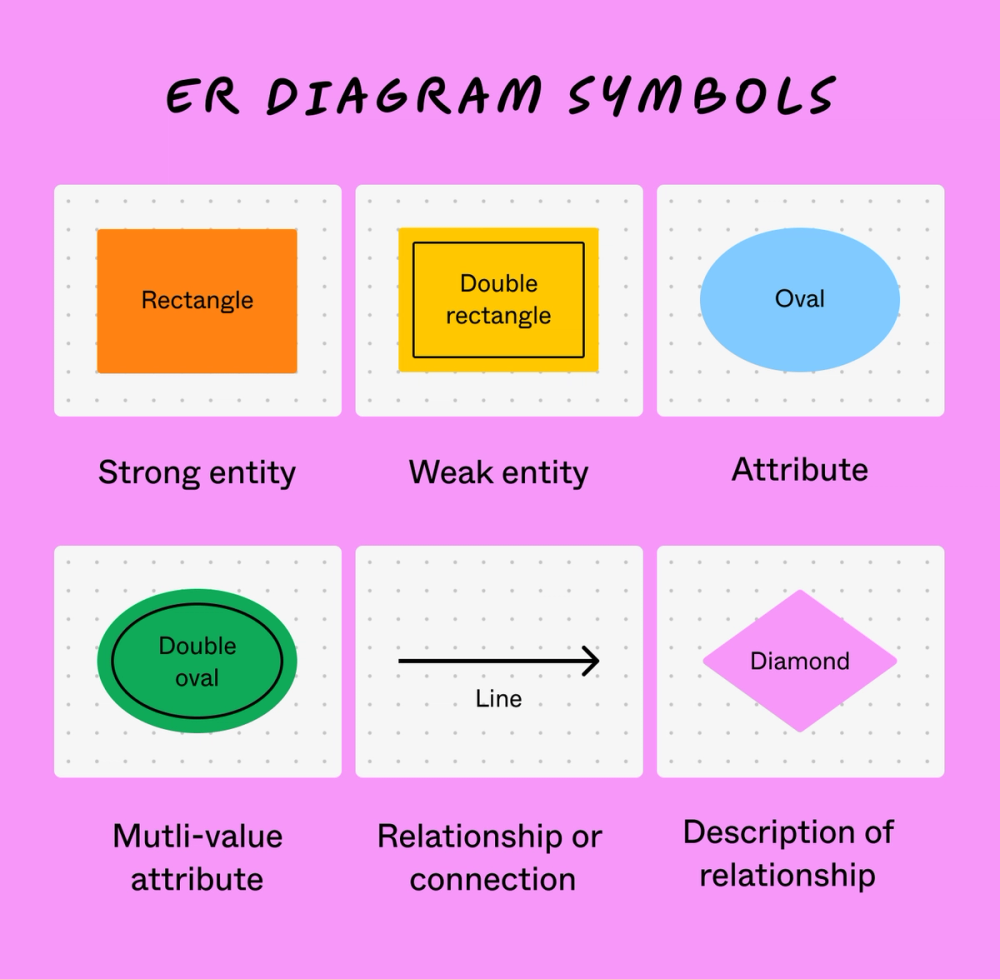
ER diagrams consist of three essential shapes connected by lines: rectangles, diamonds, and ovals. However, they work quite differently from flowchart symbols.
Note: Symbols may differ depending on the type of ER model you are using.
How to create an ER diagram in five steps
From design to development, an ER diagram can stop things from getting lost in translation. Follow these five steps to create one with FigJam’s templates and online ER diagram maker.

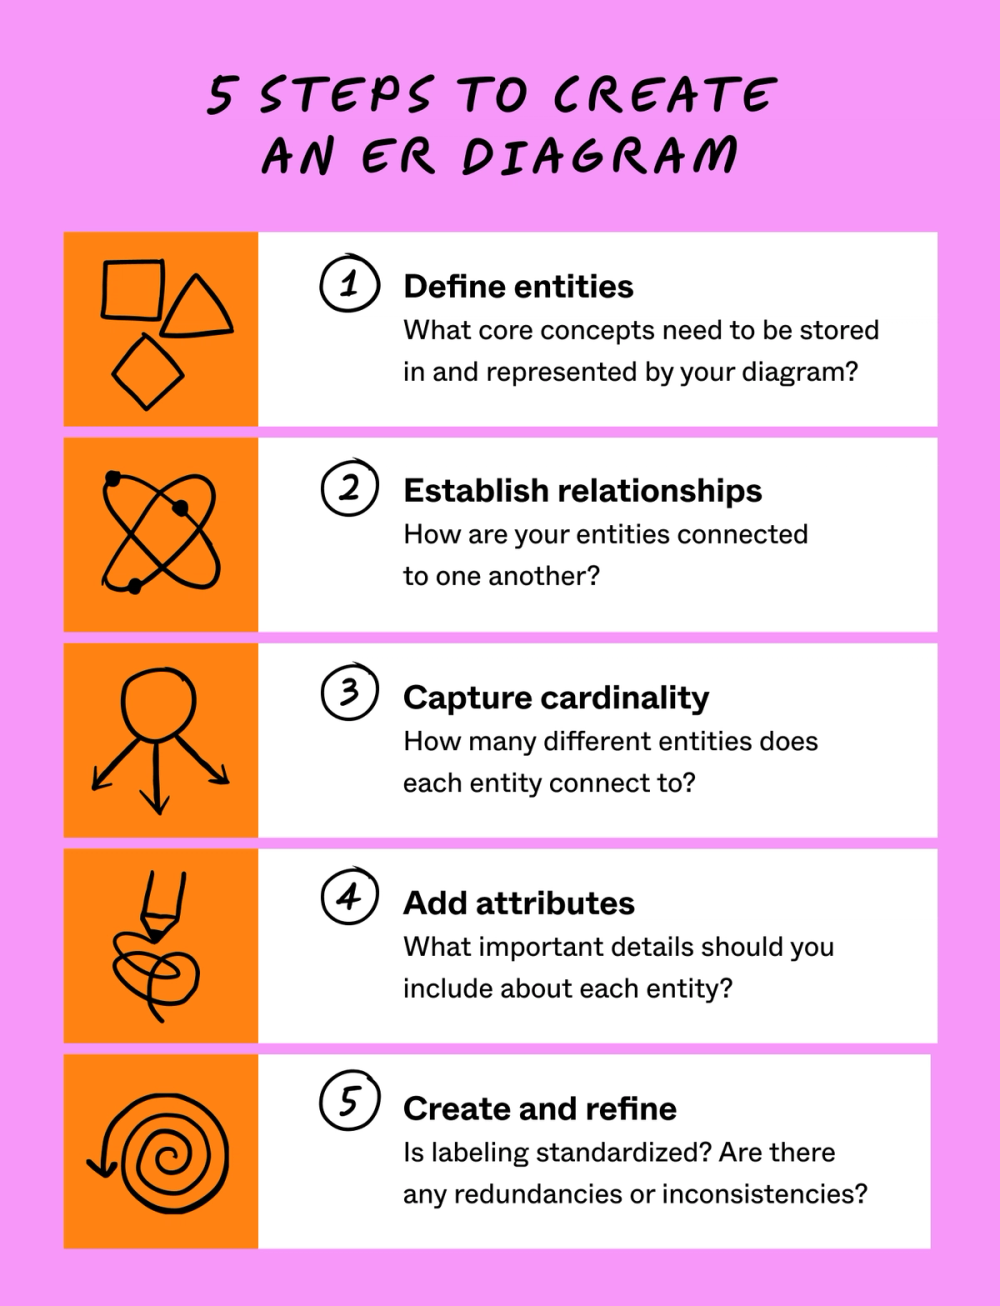
Step 1: Define your entities
Determine the core objects or concepts in your system. Each entity represents a real-world object or concept that needs to be stored in the database.
List all the different entities in your system, whether it’s a physical data model, digital-only, or a combination of the two. For example, your schema could include assets approved for use in a campaign, such as a photo, logo, font, or template. You also might list different entities where you’ll use them, like a social media post, a campaign email or physical mailing, billboard, or ad appearing in search results.
Step 2: Establish relationships
How are your entities connected? Map out how your entities relate to one another in a flowchart that captures any dependencies. For instance, if a photo is approved for use in social media posts, the relationship between “x photo” and “y social media” could be captured as "x approved for y.”
Step 3: Capture cardinality
Plot out how many entities each entity connects to, showing its cardinality. For example, you may want to show that a photo has approval for use on Instagram and Pinterest. In this case, you’d sketch out a one-to-many relationship because one entity connects to more than one other entity.
Step 4: Add attributes
Decide which key attributes you’ll use to describe each entity (or creative asset, in this case). Is the asset a PDF or an MP3? Does it have a single use (like a weak entity) or can it be repurposed (strong entity)? Is it for one audience segment versus another, or many? Tag your entities with relevant attributes.
Entities can have a ton of potential attributes, but don’t overload your diagram with too many details at first. Start with the basic information that applies to your current project.
Step 5: Create the diagram and refine
Using ER diagram symbols, map out your entities and their connections and attributes. Use an online tool like FigJam to bring your ER diagram to life with a ready-to-go template. With real-time collaboration in an easy drag-and-drop editor, FigJam was created with product and design teams in mind.
Too much duplicated data can make a mess of your ER diagram. To minimize errors and confusion, carefully review your ER diagram upon completion to ensure it accurately represents your data requirements. Check dependencies, ensure all attributes and relationships add value to the system, and standardize the labeling or naming of entities. Finally, check for redundancy and inconsistencies, then make any necessary adjustments.
Start diagramming with FigJam
When all is said and done, what is an ER diagram? It’s a simple yet powerful tool that helps product managers, designers, and developers align on the structure of databases and systems, paving the way for smooth collaboration and better results.
Ready to create an ER diagram of your own? Figma can help. Here’s how:
- Check out ER diagram examples from the Figma Community to get inspired.
- Use drag-and-drop tools to arrange your symbols, shapes, and other elements on a grid for a quick, clear, and polished ER diagram.
- Browse Figma’s template gallery for additional templates to streamline your workflow.
- Get your whole team involved and gather stakeholder feedback with comments and emojis on FigJam’s shared online whiteboard.
FigJam CTA
Ready to sketch out a system that works for everyone?