How to create an organizational chart in five simple steps


Share How to create an organizational chart in five simple steps
Explore more from
Team productivity
Plan, align, and collaborate in FigJam
Org charts, Kanban boards, meeting notes—everything your team needs to stay on track, all in one place.


Ever had a high-stakes project kick off with energetic brainstorming, then stall at task delegation? Are you and your coworkers left wondering who makes final decisions, who reports to whom, and who owns specific responsibilities? Without a clear structure, even the best teams lose momentum.
An organizational chart brings precision to these critical questions. This visual tool helps teams streamline workflows, clarify roles, and align everyone toward common goals.
Read on to find out:
- What an organizational chart is and when to use one
- How to create an organizational chart
- Key benefits of organizational charts
- Org chart best practices
- Most popular org chart types
How to make an organizational chart
To build your organizational chart, follow the steps in this guide:
Step 1: Define the purpose of your org chart
Start by setting a clear goal. Is your goal to improve communication, streamline decision-making, or manage organizational change? Document your objective to guide the chart’s development.
Step 2: Choose the appropriate org chart type
Browse org chart templates. Select from hierarchical, flat, matrix, or divisional structures based on your organization’s needs and project purpose.
Step 3: Collect organizational data
Gather current and accurate details about names, job titles, and reporting relationships to fill in your template with key details. Check job descriptions and existing employee directories for the data.
Step 4: Get creative with online tools
Looking for an easy-to-use organizational chart maker? Build your org chart with online tools, including this popular org chart widget.
Add images, text, or shapes with smart connectors that automatically align. Customize colors to match your company branding. You can do it all with FigJam’s free org chart creator.
Step 5: Share and update regularly
Keep your org chart current to reflect changes in your organization. An outdated chart can lead to confusion, while an updated one promotes transparency. FigJam’s org chart builder makes it easy to share and edit as your team evolves.
What is an organizational chart?
An organizational chart (org chart, organogram, or organigram) visualizes a company’s internal structure, showing roles, responsibilities, and relationships at a glance.
Scottish-American engineer Daniel McCallum was credited with creating the first organizational chart in 1854. Today, organizational charts are continually evolving to reflect new types of organizational structures. Picture a startup where everyone pitches in when needed, no matter their rank. A flat organizational chart sharing team roles can boost collaboration and prevent overlap.
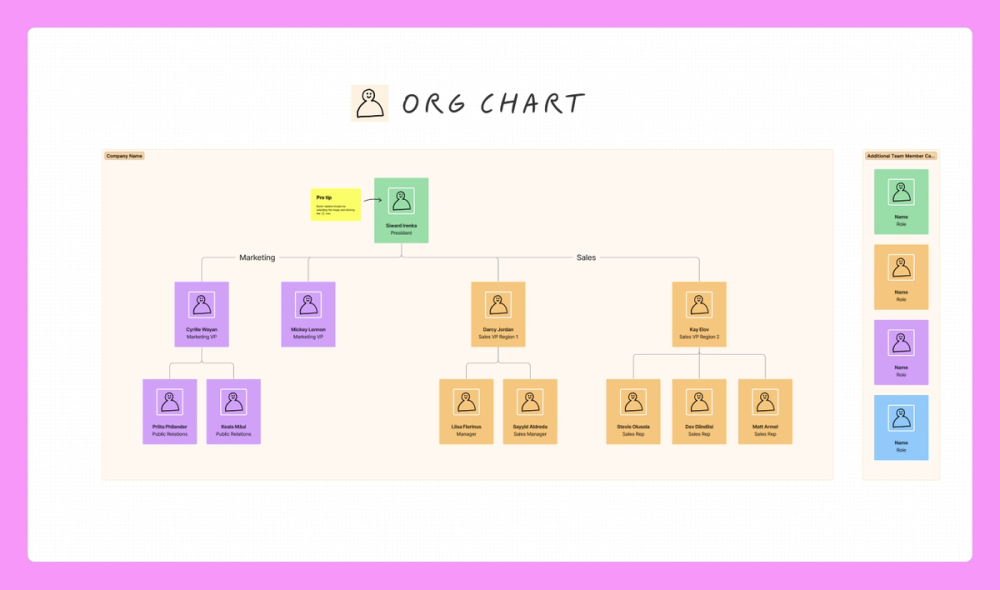
Building blocks of an org chart
Org charts are blueprints for effective teamwork. They use two key elements to map team structure:
- Boxes. Each box on an org chart contains text with information about a person, role, or department in the organization. They may also include icons and images.
- Lines. The lines on org charts indicate the flow of information or authority. Solid lines represent a direct reporting relationship. Dashed or dotted lines signify a more flexible collaborative relationship.
Together, these elements create a clear roadmap for project managers, product designers, and team leads to visualize workflows and maintain smooth collaboration.
Four key benefits of organizational charts
A bird’s-eye view of your company structure with a clear chain of command improves decision-making. An updated organization chart captures changing players and roles in real time, providing:
- Chain of command clarity. Hierarchical structures aren’t always obvious in modern organizations. But to get approvals, you need to know who’s in charge of what. Org charts get everyone on the same page, in large organizations and small startups alike.
- Enhanced communication. With teams spread out across offices and time zones, you might not know who to go to for what. Org charts capture names, roles, and contact information, facilitating effective communication.
- Streamlined management. Leaders can consult org charts to make informed choices when delegating work, distributing resources, and managing performance.
- Change visibility. When a company restructures or expands, org charts can capture how these changes impact employee roles and responsibilities. Clear, updated org charts help make transitions smoother and more transparent.
When to use organizational charts
Organizational charts make team planning and collaboration easier, especially at four crucial moments.
Budgeting
Use org charts to assess team capacity for new projects. At a glance, quickly identify available resources and bandwidth, determine staffing gaps, and plan for contractor support or outsourcing needs.
Hiring and onboarding
An organizational chart helps human resources teams spot staffing gaps and hire new employees to meet changing needs. During onboarding, these visual aids help new hires understand their responsibilities, meet their teams, and settle into their roles.
Project management
Project managers use organizational charts to manage resources across projects. Org charts help managers figure out who’s the best fit for tasks, who reports to whom, and who grants approvals.
Company restructuring
Updated organizational charts are crucial to guide teams through major changes. Teams rely on them to understand their changing responsibilities, new reporting relationships, and how they fit into the big picture.
When not to use organizational charts
Some limitations of organizational charts are worth keeping in mind. While they are powerful tools for visualizing structure, relying too heavily on org charts can sometimes oversimplify or misrepresent the nuances of a team or project.
If you’re considering how to create an organizational chart, here are some scenarios where they aren’t a good fit:
- Dynamic teams. By focusing on hierarchies, org charts struggle to reflect rapidly changing teams, agile workflows, and cross-functional groups.
- Complex projects. When roles and responsibilities overlap significantly, org charts can become cluttered or confusing.
- Temporary relationships. Creating an org chart might be unnecessary for short-term initiatives or partnerships, like freelancers.
Alternatives to organizational charts
When org charts aren’t suitable, explore these other visualization solutions:
- RACI charts. “RACI” stands for “responsible, accountable, consulted, informed.” RACI charts may be more effective if your primary goal is to clarify roles and responsibilities in a project.
- Flowcharts. A work flowchart might be best for mapping out processes. Many types of flowcharts provide better clarity than an org chart.
By choosing the right tool for your specific needs, you can stay on track and avoid miscommunication.

10 types of organizational charts for modern organizations
What type of org chart is the best fit for your organizational structure? That depends on your company’s size, goals, and culture. Consider the popular org chart examples below for details on different types of organizational charts.
Type 1: Hierarchical org chart.
Works best for: large corporations and government agencies
Hierarchical organizational charts are especially common in large companies and government departments. The flow of authority and responsibility is often top-down—from the C-suite to the most junior employees, and from the presidential cabinet to aides. Leaders sit at the top, with support staff ranked in tiers below.
Type 2: Flat org chart.
Works best for: startups and small businesses
Flat or horizontal organizations typically have fewer layers of middle management, so their charts have fewer layers and employees have more autonomy. Flat org charts are popular among startups and small businesses for tight teamwork and quick pivots. Entry-level employees may report directly to top management and have direct relationships with vendors.
Type 3: Matrix org chart.
Works best for: project-based companies and creative agencies
A matrix organizational chart groups employees into departments by skill and role. A matrix structure makes sense for many creative teams, who handle many projects simultaneously for different teams and project managers. In these cases, rank and title are less relevant than skillsets and assignments. For example, a designer’s time may be allocated by a creative director to projects across departments, from product to marketing.
Type 4: Divisional org chart.
Works best for: large multinational corporations
A divisional structure (or multi-divisional form) is often divided into geographic regions or product lines. Each division has autonomy while still working toward shared organizational goals. For example, a global brand could have international divisions with unique org charts while maintaining global brand standards and company values.
Type 5: Functional org chart.
Works best for: professional services, healthcare providers, and educational institutions
While still using clear departmental divisions, a functional organizational chart mainly groups employees based on their skills or expertise. This encourages consistency and helps reduce duplicate work.
Type 6: Team-based org chart.
Works best for: tech companies and other fast-paced industries
A team-based organizational chart is a good fit for companies that prioritize collaboration, agility, and adaptability. This structure organizes employees into small cross-functional teams focused on specific goals, projects, or products. Rather than emphasizing hierarchy, team-based org charts promote shared responsibility and interdepartmental communication.
Type 7: Process-based org chart.
Works best for: manufacturing and supply chain management
Think of a process-based org chart structure like an assembly line—it breaks the workflow into separate steps overseen by different people. In this structure, quality control and efficiency are the top priorities.
Type 8: Network org chart.
Works best for: consulting firms and nonprofits
This structure is suitable for companies that work with many third-party vendors, freelancers, and other collaborators. A network org chart explains who makes decisions and how each team interacts with external partners. Authority is usually evenly distributed.
Type 9: Circular org chart.
Works best for: creative agencies and employee-owned businesses
A circular structure org chart is a lot like a dartboard or bullseye target, with each inner ring getting closer to core leadership. There is no top-down command structure; instead, information radiates outward for decentralized decision-making. By valuing transparency over hierarchy, this format encourages cross-department collaboration and the free flow of information among all parties.
Type 10: Line org chart.
Works best for: small businesses, retail, and hospitality
A line structure for an org chart is straightforward, with authority flowing straight from top to bottom. It is simpler and more direct than a hierarchical structure, though they share some similarities. This format is easy to set up and manage, giving clarity to small businesses. However, the lack of flexibility sometimes creates bottlenecks.

Org chart best practices
Effective org charts help both new and existing employees understand the big picture. Follow these guidelines to excel at creating clear, usable org charts:
Consider accessibility
Use clearly legible font sizes and color palettes. When your org chart is finished, remember to enable sharing and editing permissions where needed. You should be able to easily find, share, and update the chart as your organization grows.
Stick to one page
Arrange boxes and groups horizontally and vertically, but don’t make your chart too wide or too tall. It should all be able to fit on one page and people should not have to scroll to find what they need. If your org chart is too big, consider splitting it into smaller charts that are linked together.
Determine your grouping methodology
While it’s common to create an org chart based on an organization’s reporting structure, there are other options to consider. Will the people in the chart be grouped by roles/departments, location/time zone, client pack, or function? Why or why not? Consider grouping employees with the same title into one box to save space.
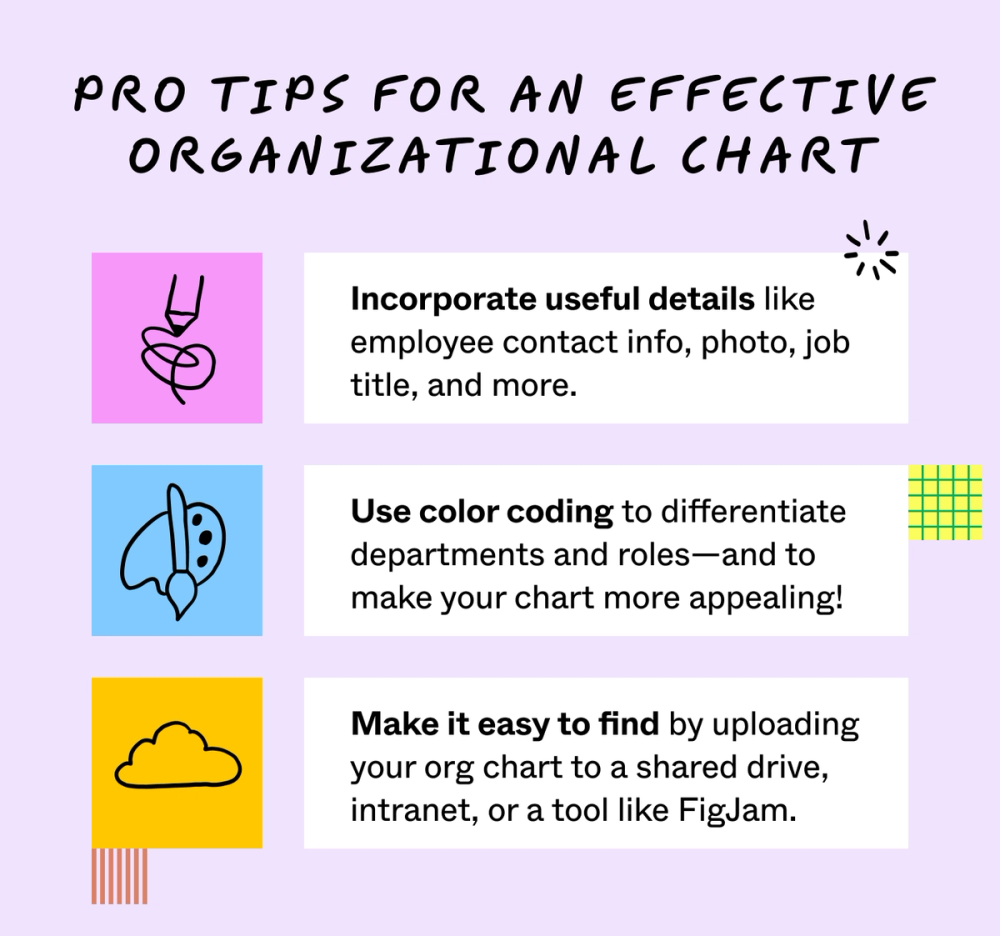
Incorporate handy details
Boost transparency and usability with useful employee info, such as contact information, photos, and department functions. You can even include links to more detailed job description docs, portfolios, and more.
Use color coding
This simple trick makes departments and roles easy to tell apart at a glance—and makes your chart more memorable and appealing. Consider using shades from your brand book’s color scheme.
Make it easy to find
Accessibility is important. Your hard work won’t be useful if no one can find it! Upload your org chart to a shared drive, intranet, or a tool like FigJam.
Jumpstart your organizational chart with FigJam
Now that you know how to create an organizational chart, it’s time to boost transparency and collaboration with compelling, accurate organizational charts created with FigJam’s shared online whiteboard. Use it to:
- Brainstorm, design, and chart reporting structures
- Guide project team members to success with clear roles and reporting lines
- Explore design options to add brand elements to your organizational chart
- Browse org chart examples from the Figma Community
Ready to design clearer roles and responsibilities?
Keep reading


What is a stakeholder analysis
Learn how to identify key players in your next big project.

What is a matrix organization—and how to create one
Learn how to build a collaborative work environment.


Strategic management process
Every company needs an in-depth plan to stay ahead of market shifts—and their competition.