What is a UML diagram?


Share What is a UML diagram?
Explore more from
Team productivity

You’ve got a great idea for a new app or software feature—but first, you need to show your boss or investors what you have in mind. Unified Modeling Language (UML) diagrams help you communicate complex systems clearly, even to non-technical teams or stakeholders.
UML modeling diagrams use standardized symbols and layouts to model a system's structure and behavior. They’re used by developers, designers, product managers, and systems architects to document everything from user flows to system architecture.
In this guide, you’ll learn:
- What a UML diagram is and why you should use one
- Different UML diagram types and how to read them
- Real-world UML examples
- Best practices for using a UML diagram
What is a UML diagram?
A UML diagram serves as a blueprint for a software system, illustrating its behavior. To standardize software modeling, UML diagrams use the Unified Modeling Language, a standardized approach that uses graphs and notes to visually represent software systems. This helps developers and other key players describe, design, and document technical details with ease.
Why use a UML diagram?
UML diagrams can capture a wide variety of software systems, from inventory systems to banking applications. UML diagrams are key communication tools to help you:
- Simplify large or complex systems. Technical and non-technical stakeholders can quickly grasp a concept or app in product development.
- Improve collaboration. UML provides developers with different language skills and processes a common language, helping them to work more effectively together.
- Drive alignment. Multiple teams can sync up with easy-to-understand diagrams.
- Show the complete picture. UML diagrams capture a system’s overall concept, key components, and functionality.
- Minimize errors. Teams can spot and resolve potential bugs quickly.
UML diagrams fall within two basic categories: structural and behavioral. Once you understand how these diagrams work, you’ll be able to read and build any UML diagram.
Types of structural UML diagrams
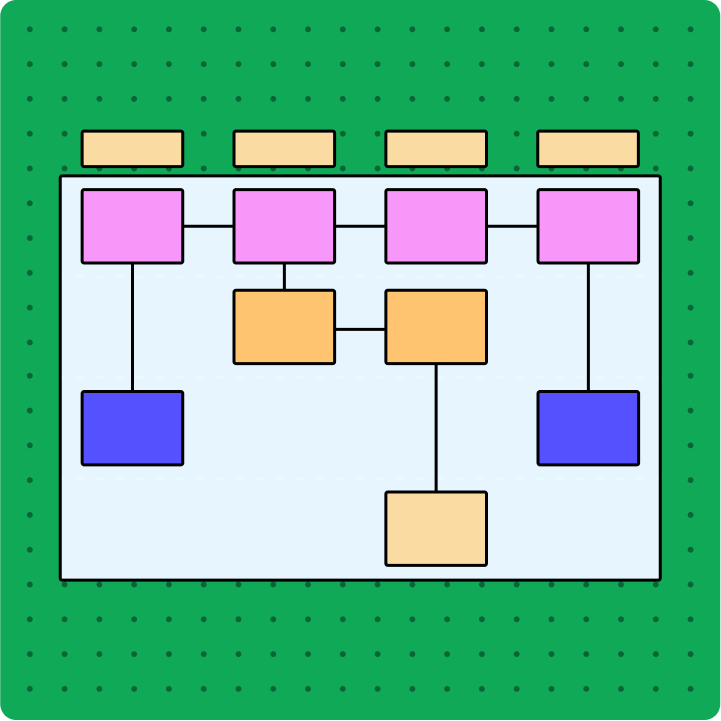
Structural diagrams represent technical frameworks that detail the static components of a structure or system. These basic structures and building blocks keep your software running.
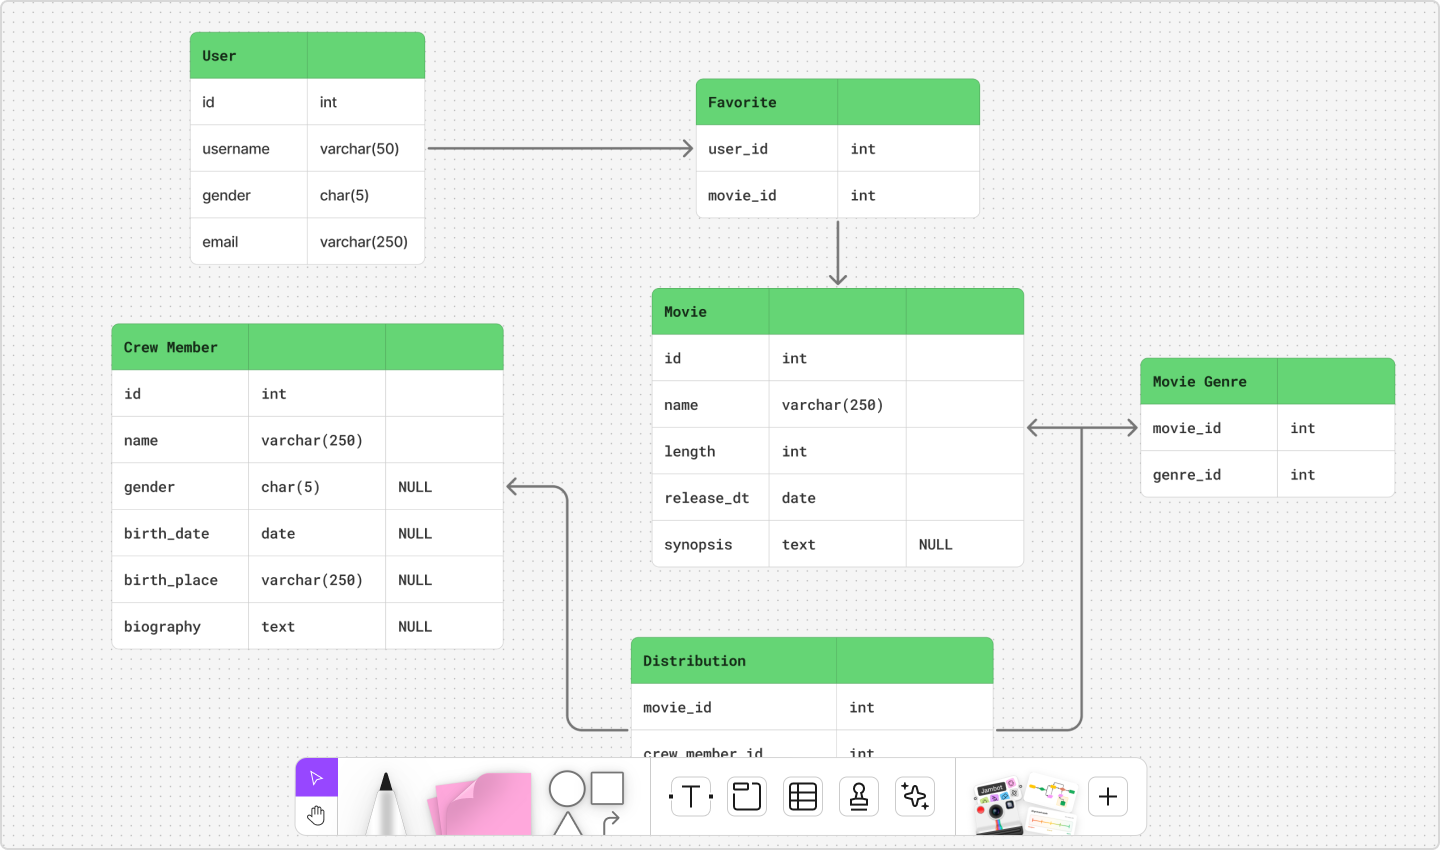
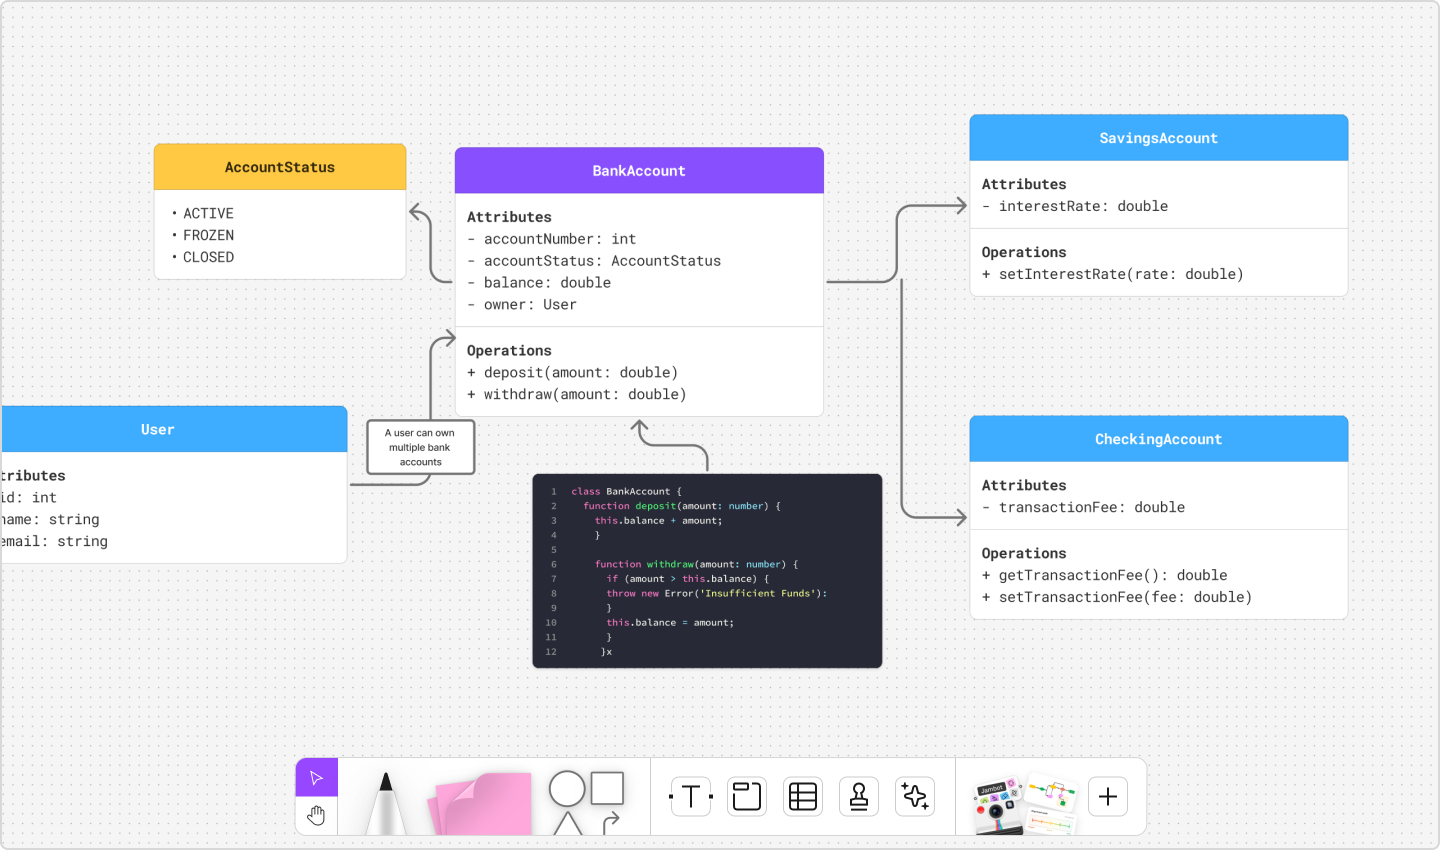
Type 1: Class diagrams
Best for: Creating a general blueprint of a system
These diagrams capture classes (or objects), showing their attributes, methods, and relationships. For example, in a system for a movie platform, user information, movie title, and movie genre each represent a class, with arrows showing relationships between them.
User information attributes include username, email, and user ID. Methods or functions could include add username, edit username, and delete username.

Type 2: Component diagrams
Best for: Demonstrating the relationships between major objects in a system
UML component diagrams organize components and subcomponents within an object-oriented system and document how these components interact. In an email app, components include email management, inbox, and outbox. Subcomponents of email management include system administration and front-end HTML.
Type 3: Composite structure diagrams
Best for: Demonstrating the relationships between minor parts of a system
Use these diagrams to illustrate how the components of a system interact to enable it to function. For a bank ATM system, those parts might include a central processor, card reader, memory, and modem.

Type 4: Deployment diagrams
Best for: Showing how your software works within different operating systems
This diagram type demonstrates software deployment across hardware components. Your deployment diagram could show hardware such as a client server, database server, and an individual PC, with collaboration software layered on top.
Type 5: Object diagrams
Best for: Capturing how a system operates during specific circumstances
Like class diagrams, UML object diagrams capture object-oriented systems. However, object diagrams depict a system at a specific time, which is helpful for testing different class diagram instances.
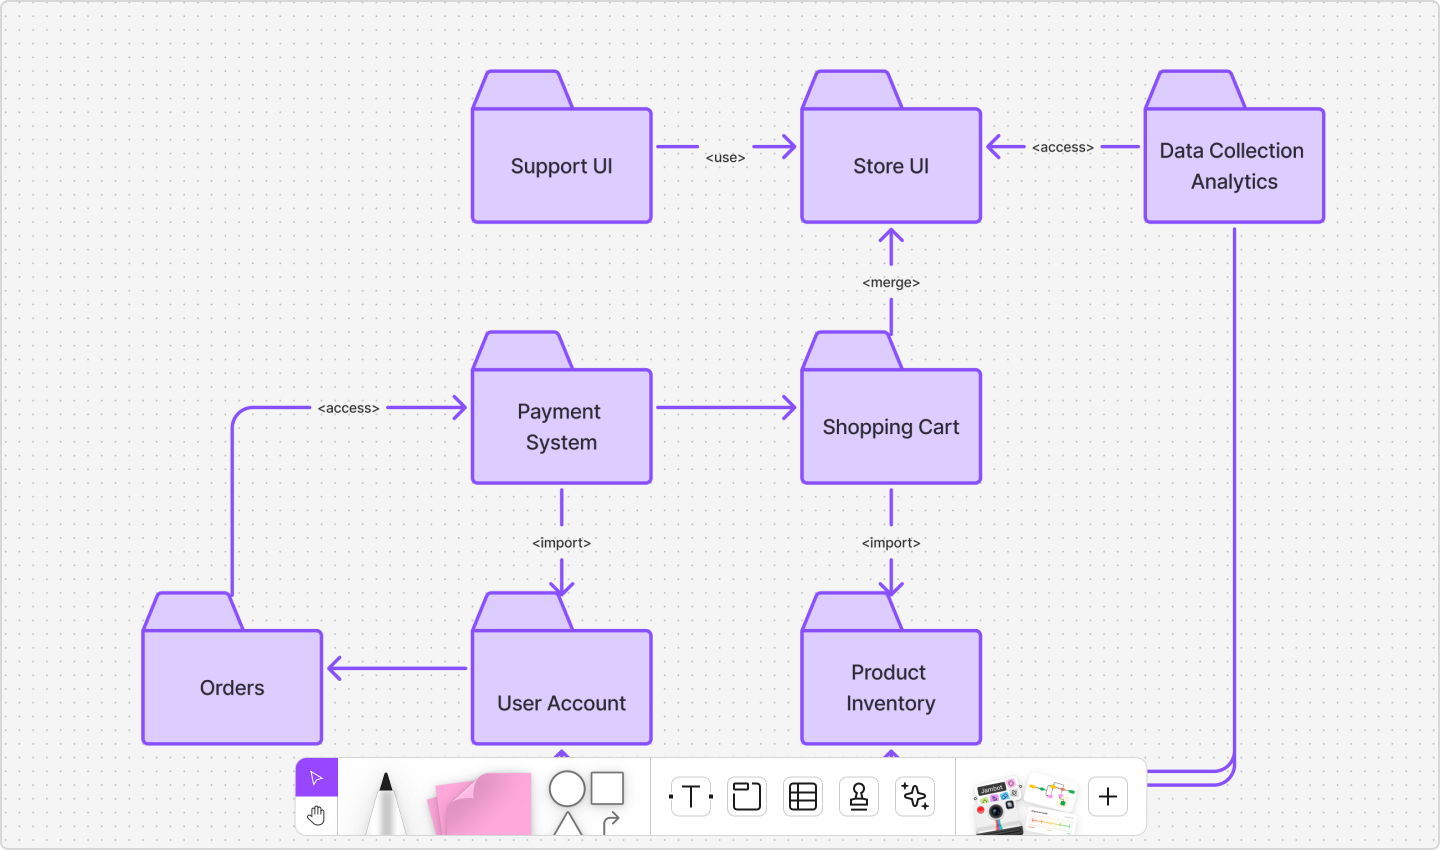
Type 6: Package diagrams
Best for: Organizing a system to show how components are categorized
These diagrams group high-level system elements into packages or folders to show their hierarchy, relationships, and dependencies. Use these diagrams for medium- to large-scale layered apps like an omnichannel shopping platform.

Type 7: Profile diagrams
Best for: Showing how a system can be customized for different use cases
This type of diagram extends your UML models by adding tags, stereotypes, and constraints. This lets you customize diagrams for a specific industry (say, telecom or retail) or platform (such as J2EE, Java, or .NET).
Not ready to start from scratch?
Get everything you need from pre-made templates in Figma.
Types of behavioral UML diagrams
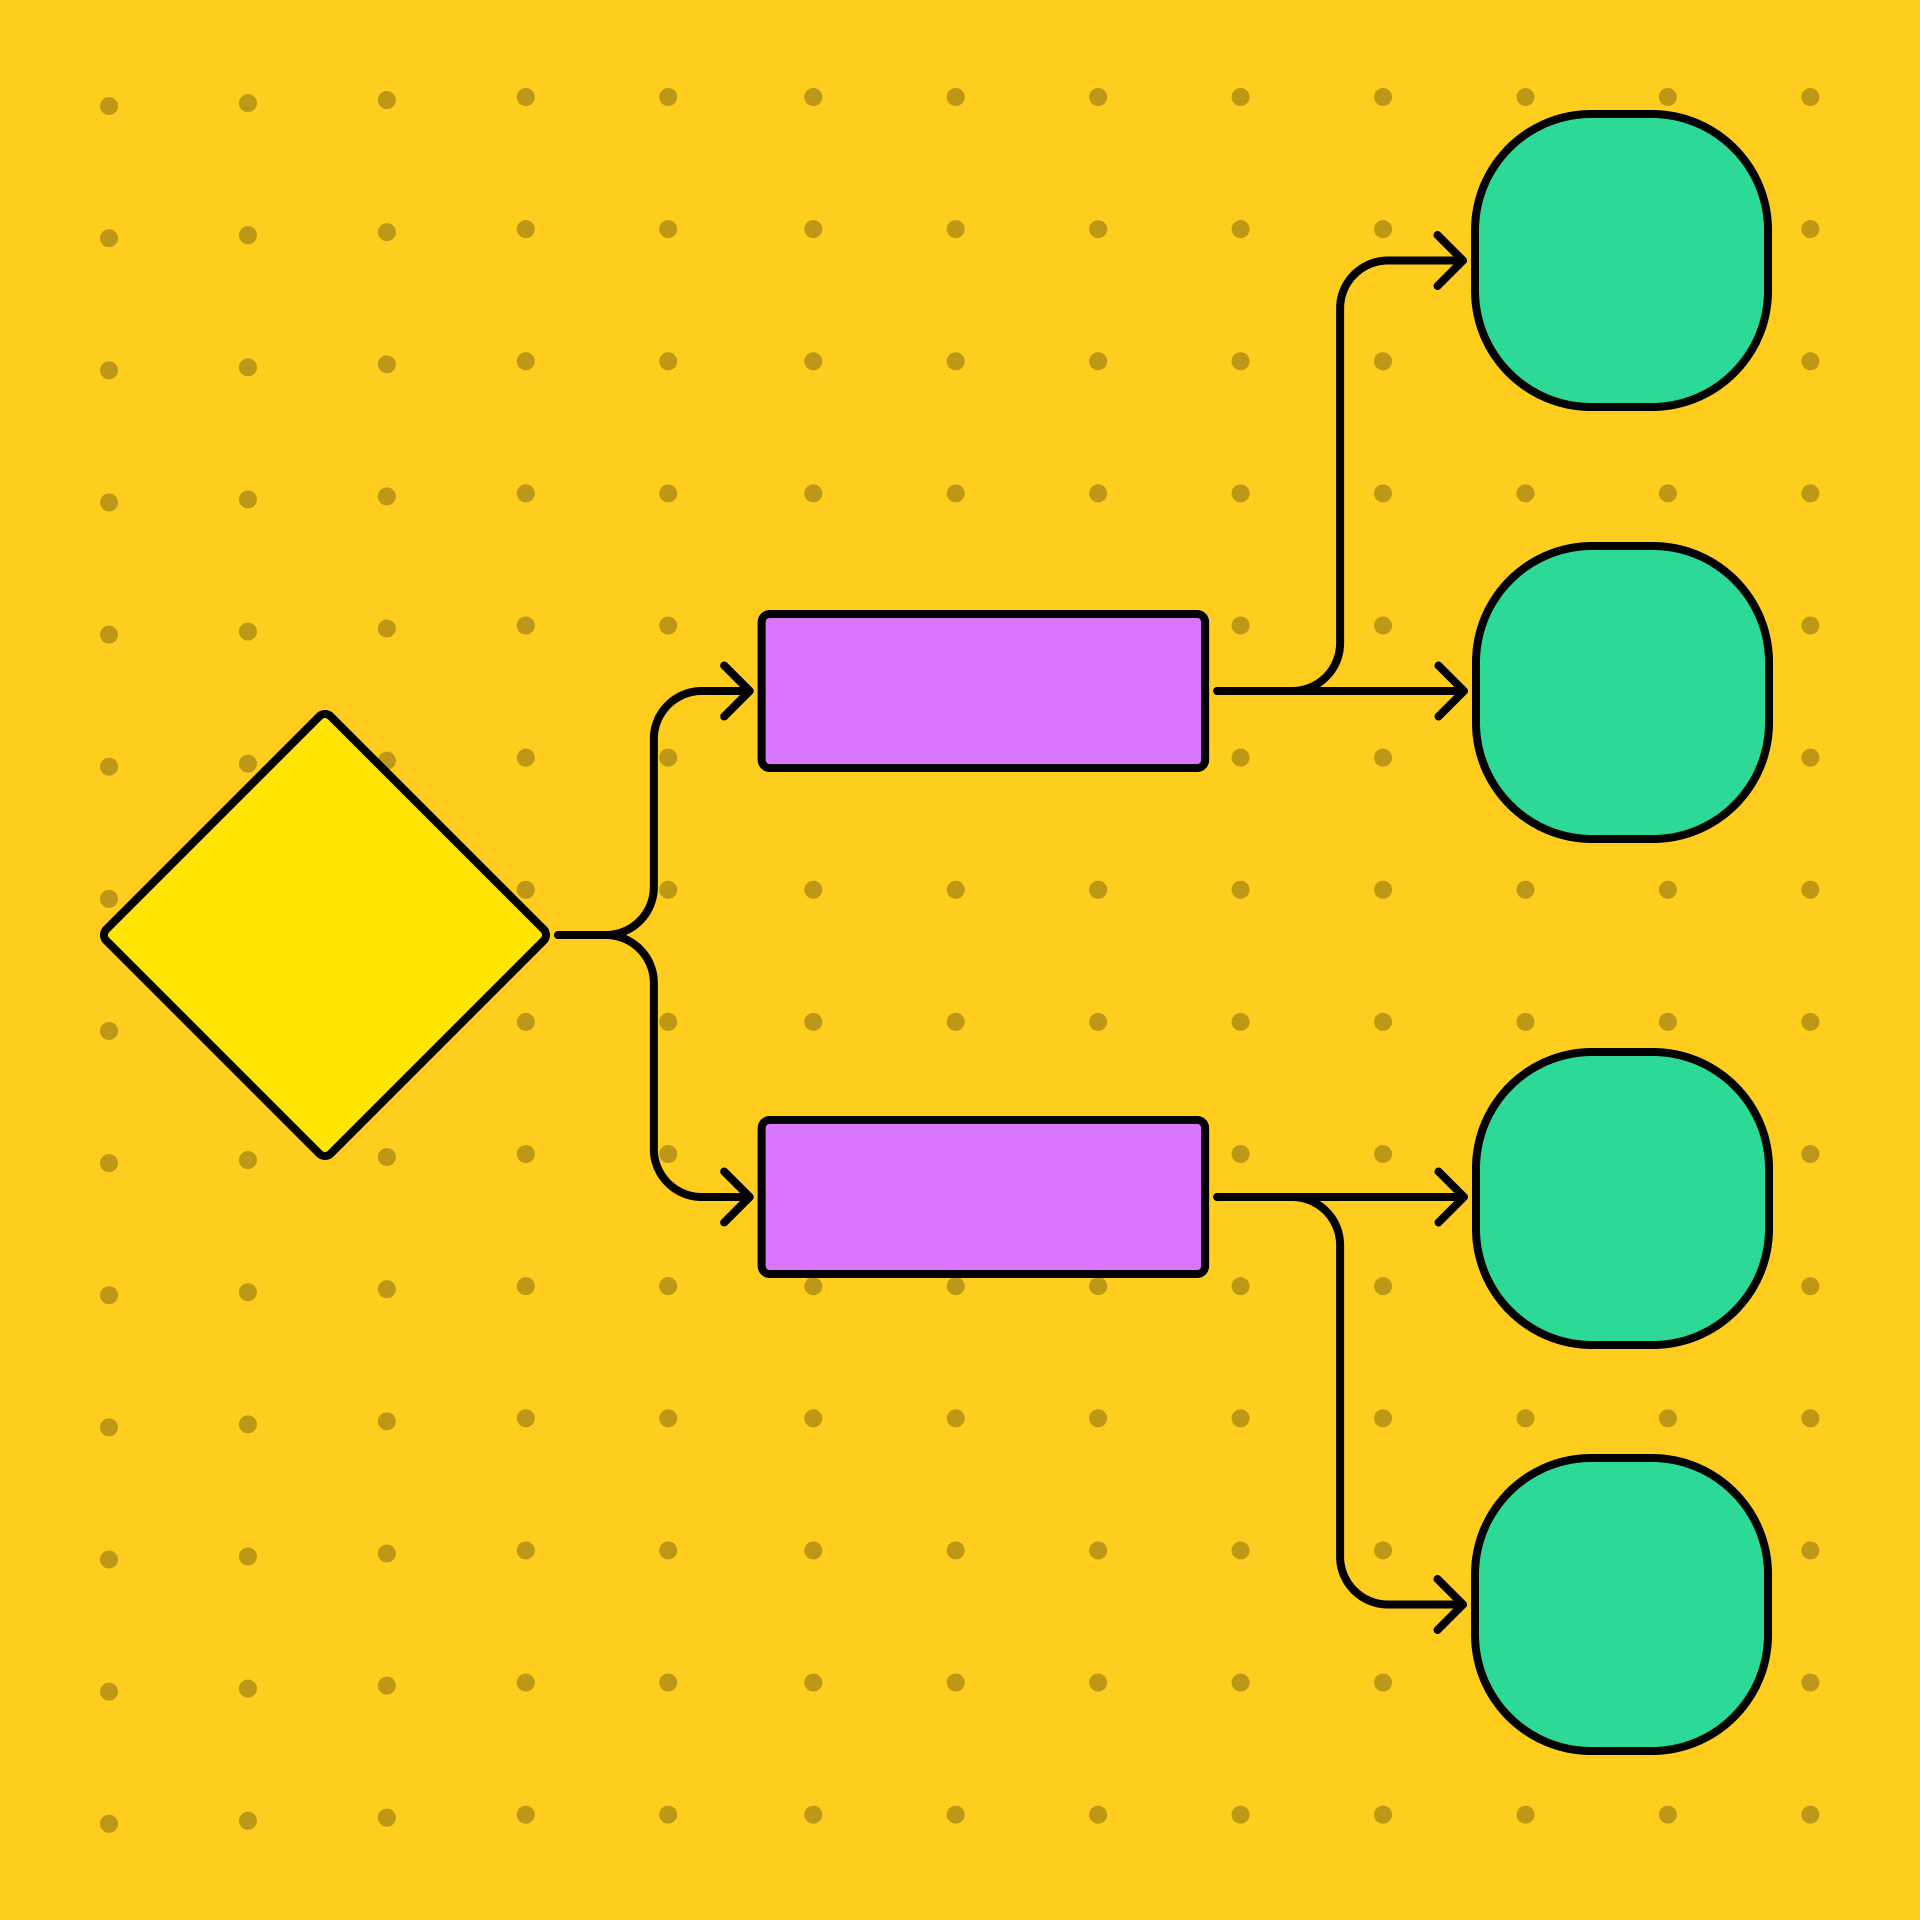
Behavioral diagrams show how things move, change, or interact over time within a system.. These diagrams illustrate the evolving factors within a system, such as how user requests trigger specific actions.
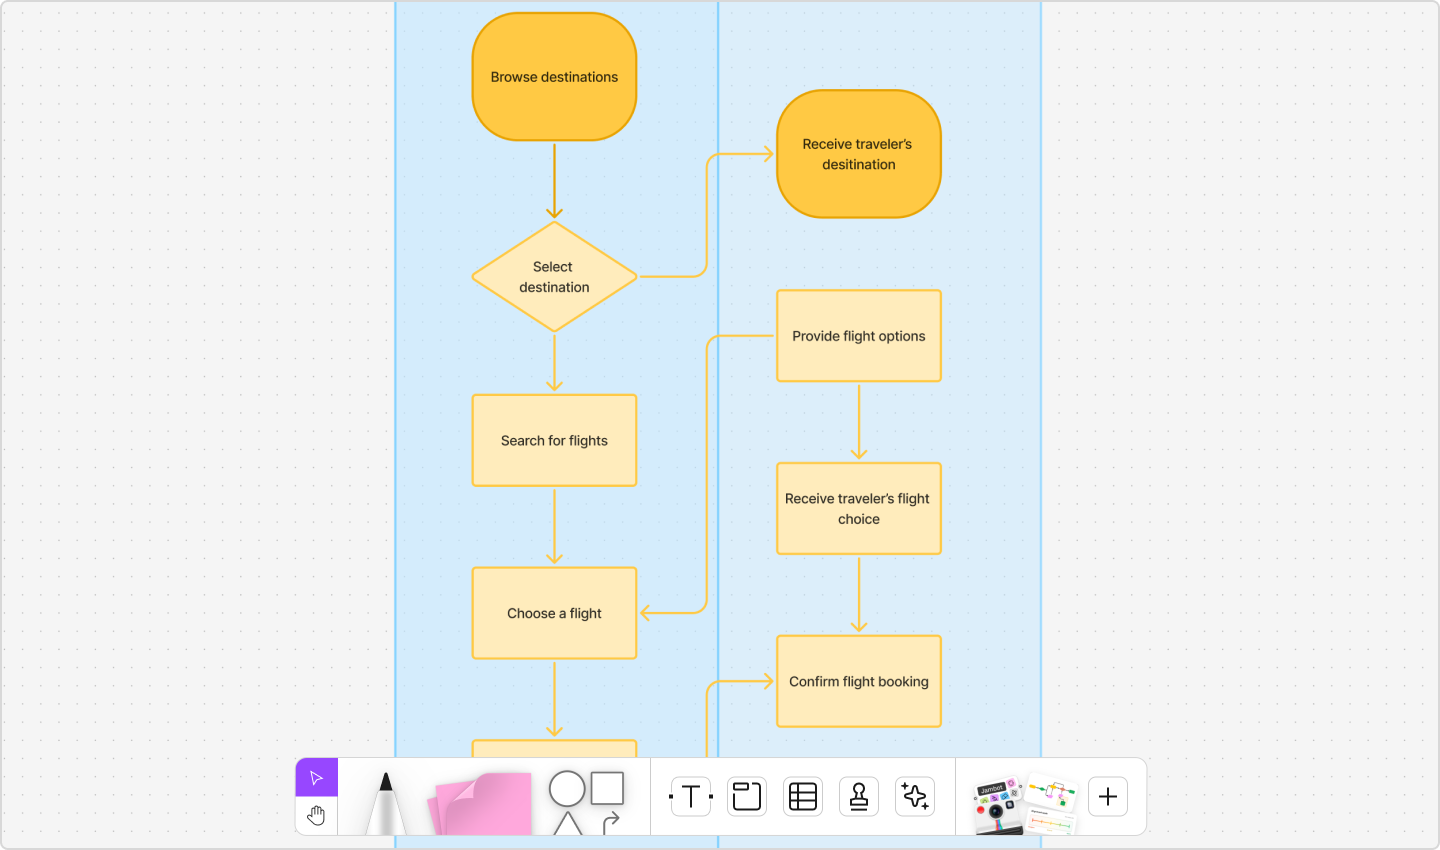
Type 8: Activity diagrams
Best for: Demonstrating how specific workflows and processes work within a system
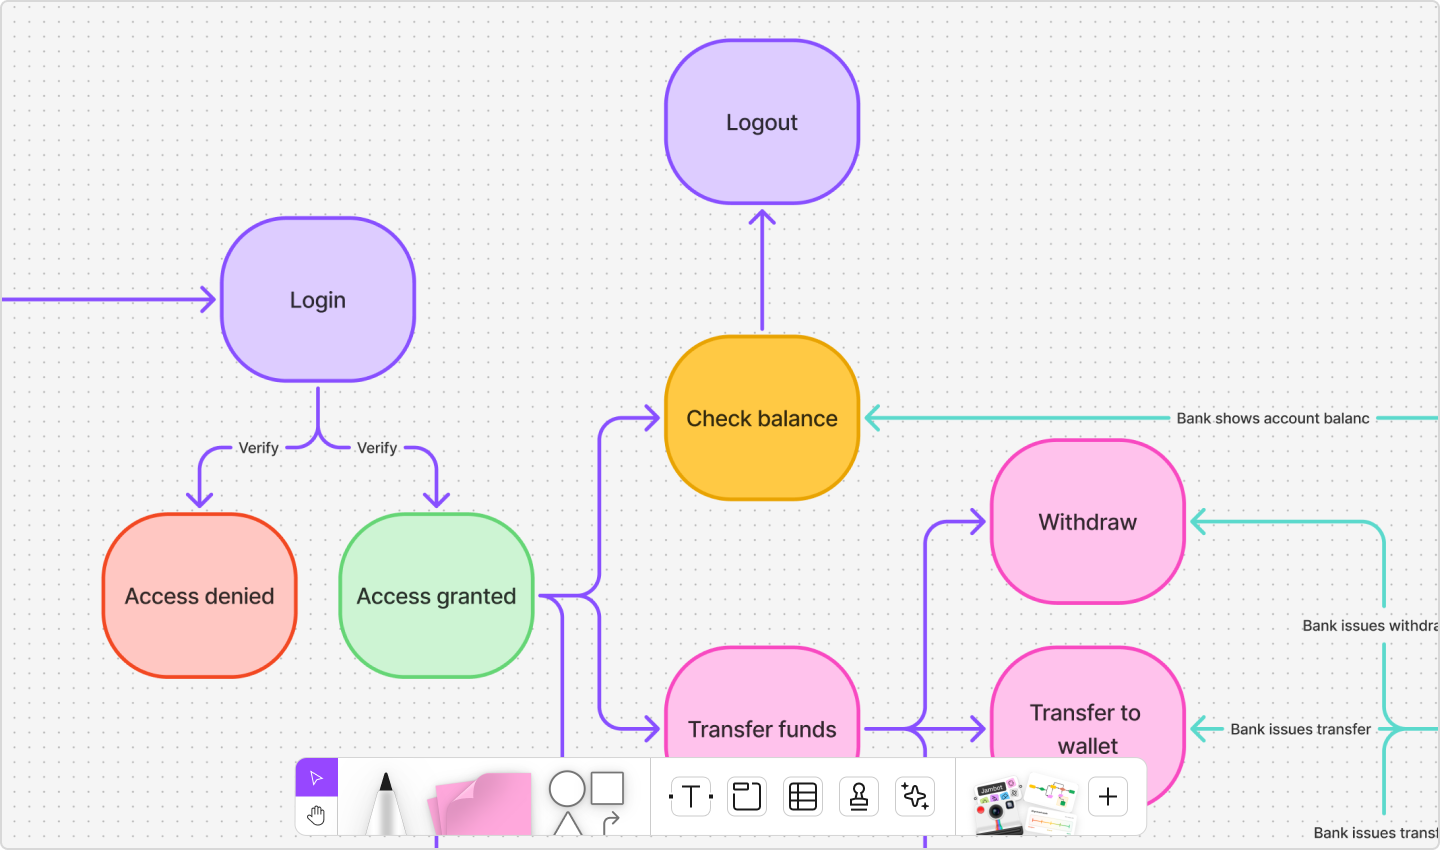
Similar to flowcharts, these diagrams plot out a system’s business or process flows—for example, payment, registration, and travel booking flows. You can even set it up like a swimlane diagram, showing each step in a workflow.

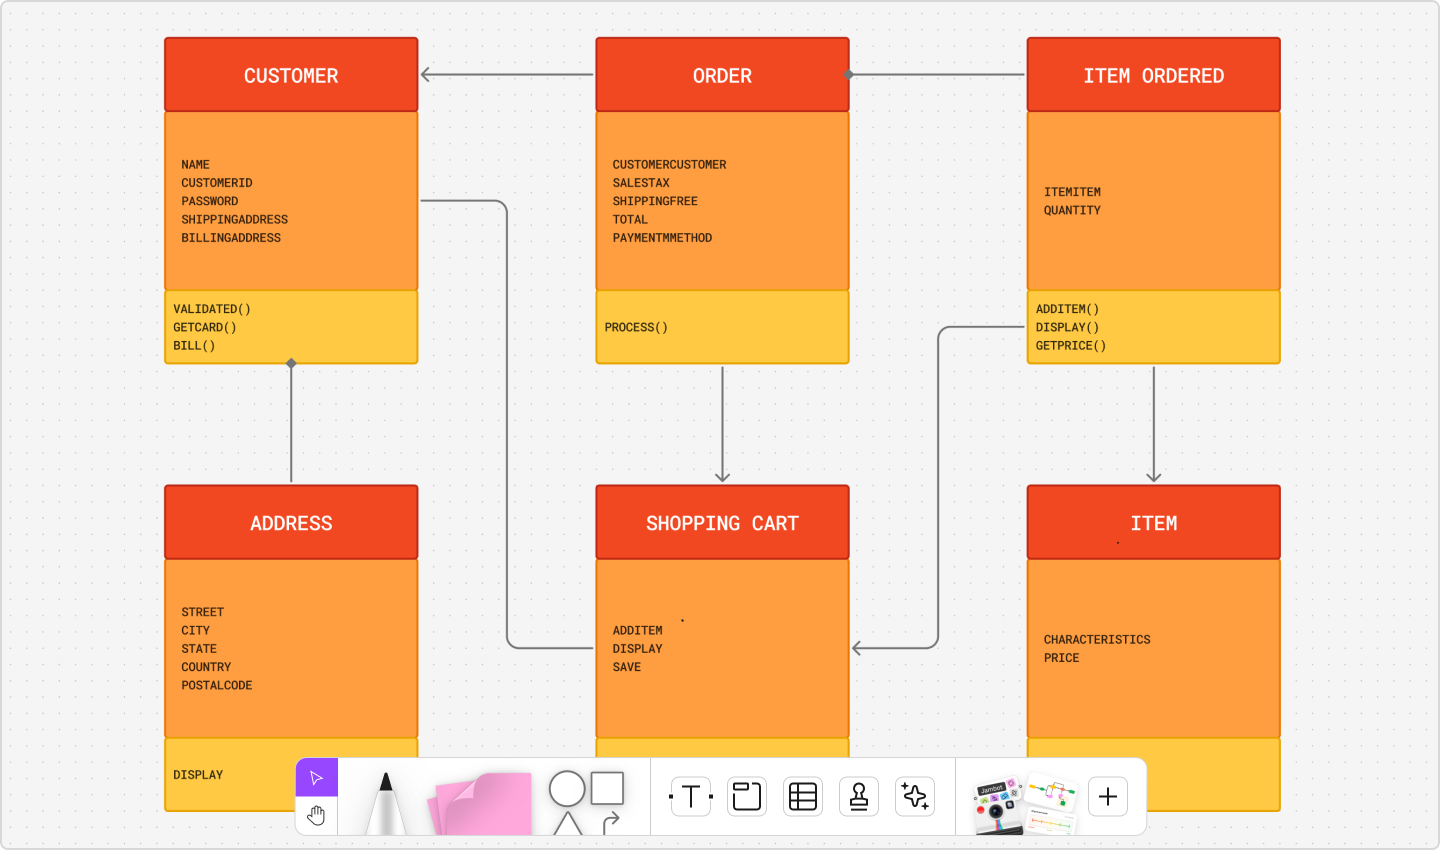
Type 9: Communication diagrams
Best for: Showing which objects communicate with each other within a system
Communication diagrams operate similarly to entity relationship diagrams. Use them to illustrate how objects send and receive messages. For example, a travel reservation system might show a flight booking message passed from object to object. Those objects could include the front end, flight carrier, reservation, and confirmation.
Type 10: Interaction overview diagrams
Best for: Creating a general step-by-step representation of how different processes work in a system
These diagrams highlight the activity and sequence between interactions. For example, an online shopping system could include searching, browsing, shopping, and checking out. An interaction overview diagram can account for the customer’s path through all these processes.
Type 11: Sequence diagrams
Best for: Recording interactions between users and the system
Sequence diagrams show the specific interactions between objects. These diagrams depict how an actor or user interacts with a system and how the system responds.

Type 12: State machine diagrams
Best for: Showing how a system can change over time
These diagrams capture a system’s components in various states responding to external and internal influences. For example, a debit card inserted into an ATM might result in a ready state or failure state. Your state machine diagram might show both states and other possible states.
Type 13: Timing diagrams
Best for: Recording how the timing of different events works within a system
With these diagrams, you can focus on the timing of events that affect system interactions. For example, your timing diagram for web browsing might display various states—such as waiting, processing, and idling—and how long each state takes when a user browses a website.
Type 14: Use case diagrams
Best for: Providing a general overview of how a system works in an ideal use case
Use case diagrams identify the actors who use a system and show how they interact with it. For example, an online banking application might engage a user and a bank. These diagrams also look at internal and external factors that influence functionality.

Making the most of a UML diagram
UML diagrams serve many different purposes. These tips can help you choose the right one from the start, saving you time and maximizing the usefulness of your diagram:
- Plan ahead. Think about exactly what you need to demonstrate to determine which diagram will be most effective.
- Use precise language. Label your diagram clearly, using concise and straightforward language to convey the details without clutter.
- Use templates. If you’re not confident about UML diagramming, start with a template to save time and make sure you include key elements.
- Be smart with icons and color. Use a visual hierarchy with distinct icons and colors to highlight key objects and relationships, ensuring the diagram remains clear and readable.
- Ask for feedback. Have colleagues review your diagram to make sure it’s clear and accurate.
- Update as circumstances change. Keep your UML diagram up-to-date so it’s useful throughout the project’s lifecycle.
Simplify UML diagramming with FigJam
Now that you’ve learned how to read UML diagrams, you can build your own. Capturing systems doesn’t have to be complicated. Figma can help. Here’s how:
- Lead an open session on FigJam’s shared online whiteboard to collaborate and gather team feedback in real time.
- Start with Figma’s UML diagram tool to set your team up for success.
- Create prompt-based functional prototypes with Figma Make to bring your big ideas to life.
Ready to show off your big ideas?
Easily create and share professional UML diagrams.