Critical path method: How to calculate and use it


Share Critical path method: How to calculate and use it
Explore more from
Strategic planning

When you’re facing blocker after blocker on a complex project, you need a systematic way to break down the work into manageable steps. The critical path method (CPM) helps you map out your project requirements into a clear sequence of tasks and deliverables.
Understanding your critical path lets you make smarter decisions about resources, scheduling, and risk management, ultimately helping you deliver projects on time and on budget.
Read on to find out:
- What the critical path method is and how it’s used
- Key benefits of using the critical path method
- How to map your critical path
- An example of a CPM UI/UX design project
What is the critical path method?
The critical path method is a project management technique that helps you identify and manage the essential tasks needed to complete a project.
CPM works by breaking down a project into individual activities, estimating how long each activity will take, and determining the order in which they must be completed. The critical path is the longest chain of dependent activities that directly impacts your project timeline.
CPM helps you estimate each activity's duration so you can set a realistic project completion date. Once you map your project’s critical path from the first activity to the last, you can identify possible bottlenecks and find opportunities for fast-tracking.
Any delay in these critical tasks will impact your entire project timeline. For example, if wireframes are delayed in a design project, everything that follows, such as visual design and development, is pushed back, ultimately impacting the project’s launch date.
CPM vs. PERT
While CPM and the program evaluation and revolve technique (PERT) help you While CPM and the program evaluation and review technique (PERT) help you schedule and coordinate complex projects, they have key differences and serve different needs.
CPM is deterministic, relying on fixed activity durations to identify the critical path. PERT is probabilistic, using a three-point estimation (optimistic, most likely, and pessimistic) to account for uncertainty in activity durations.
This probabilistic approach makes PERT more suitable for projects with high levels of uncertainty, while CPM is better suited for projects with more predictable activity durations.
Both CPM and PERT analyze these key project elements:
- Task list: everything that needs to be done
- Task duration: how long each task should take
- Task dependencies: which tasks depend on others
CPM vs. Gantt chart
While CPM helps you identify your project’s essential path, Gantt charts bring your timeline to life visually. These tools work best together: CPM reveals which tasks are truly critical, while Gantt charts show you how all your tasks fit together over project timelines.
Combining CPM with Gantt charts gives you a complete view of your project—what’s crucial, what’s flexible, and how everything connects. This powerful combination helps teams make smarter decisions about resources, risks, and schedules.
How to calculate the critical path method in six steps
The critical path method helps you deliver projects on time and within budget through these six steps.

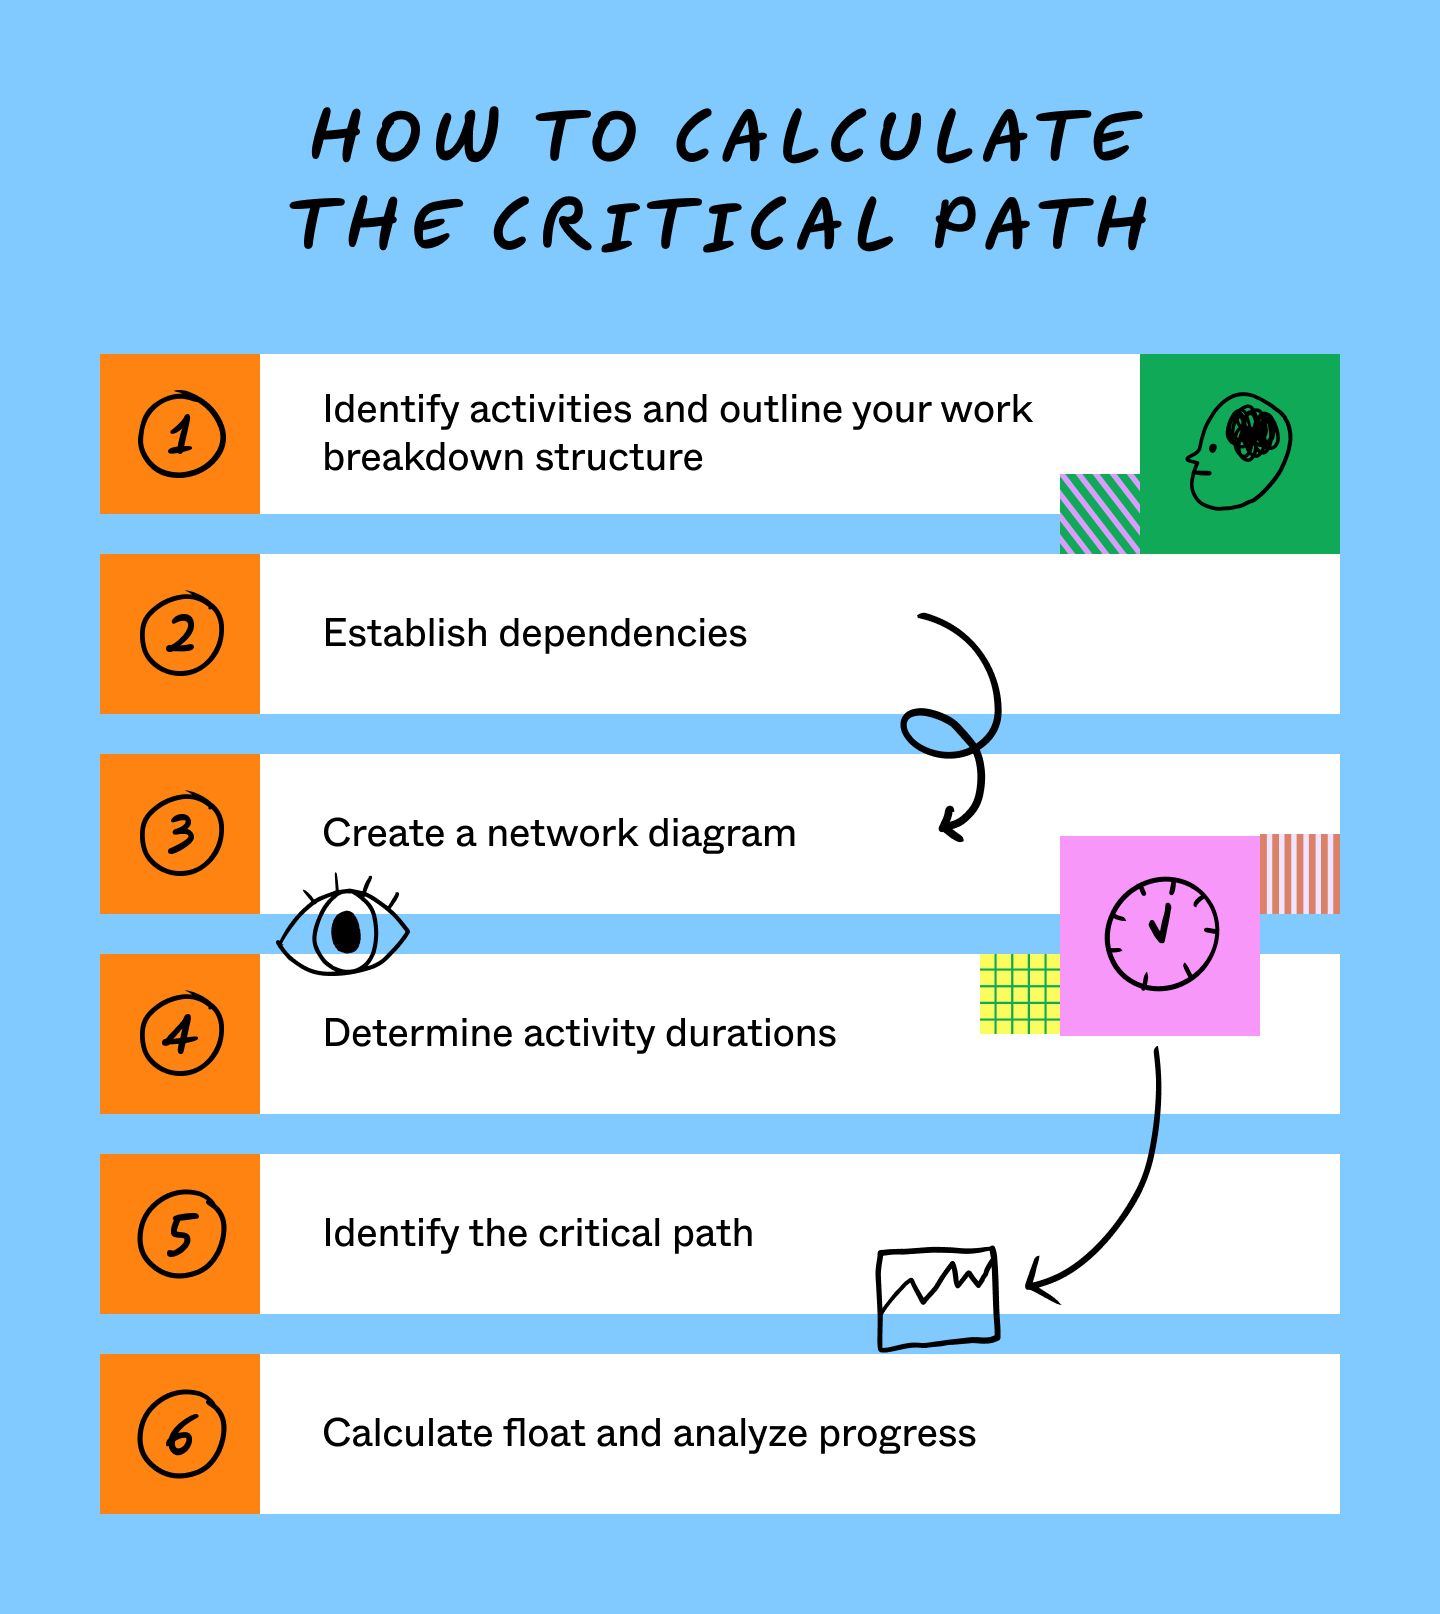
Step 1: Identify activities and outline your work breakdown structure

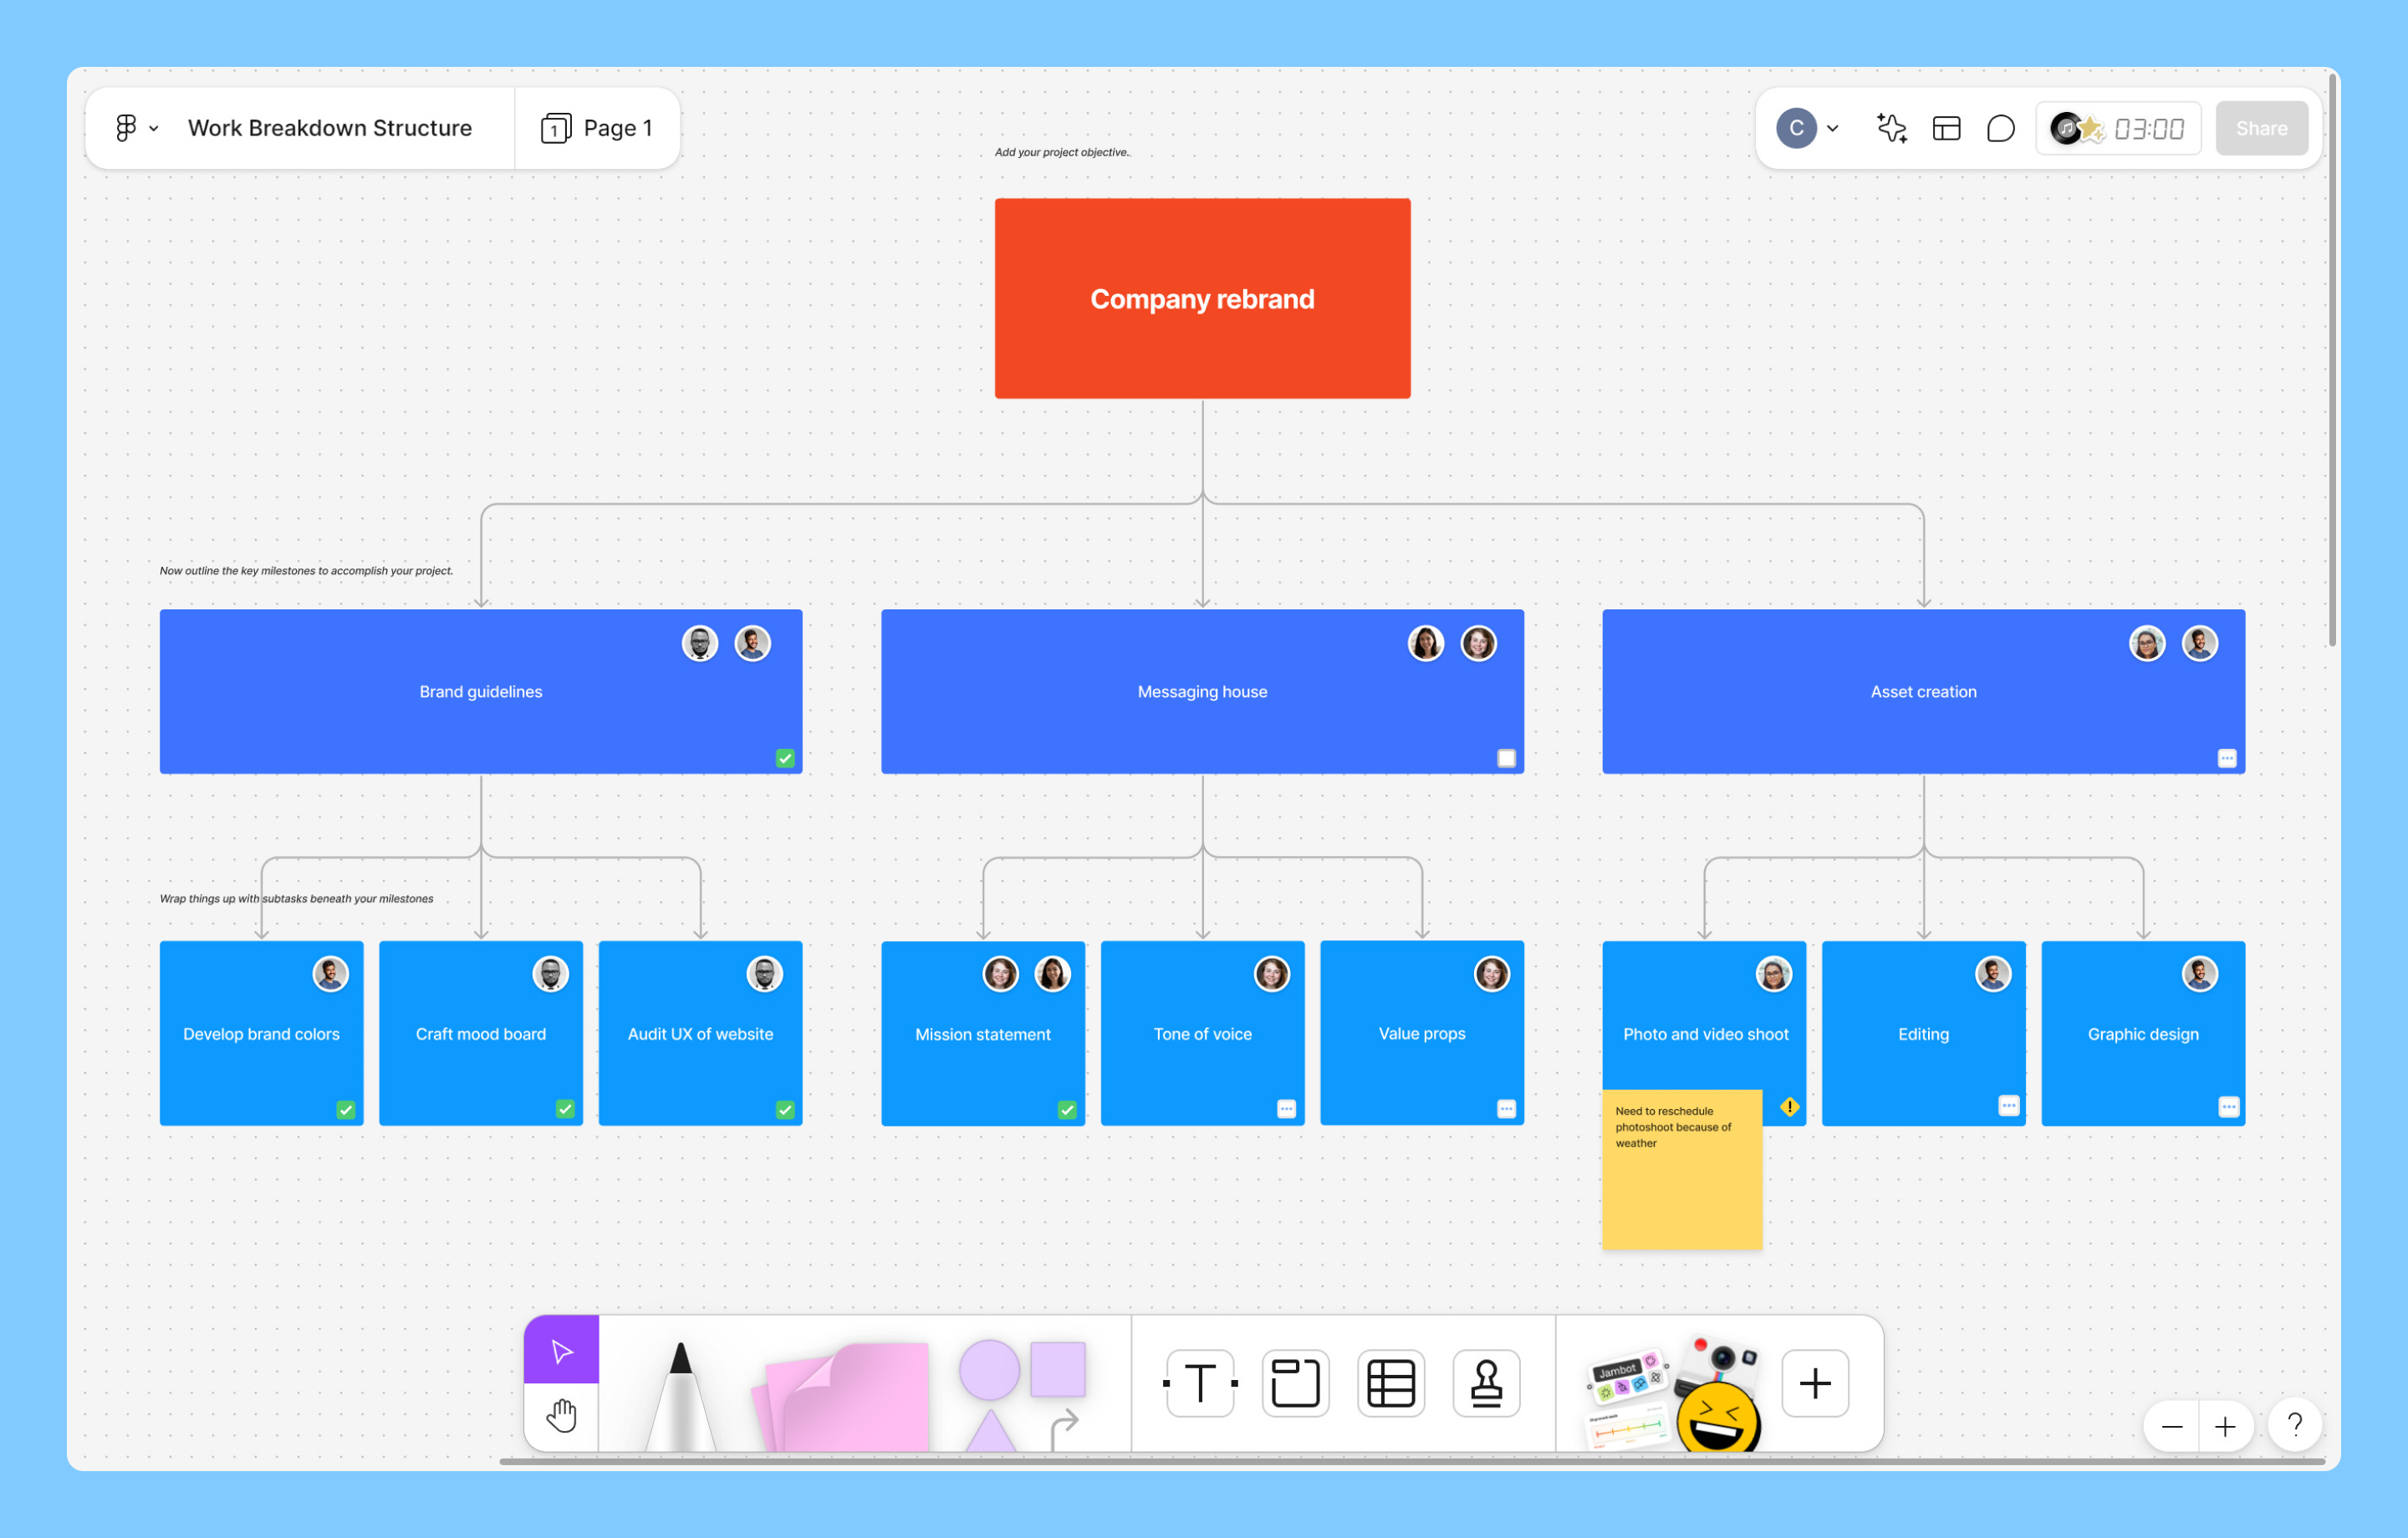
Start by breaking down your project into smaller, manageable tasks using a work breakdown structure (WBS). This hierarchical breakdown helps you organize work into clear “packages.”
List out all the activities needed to complete the project. You’ll start to see which activities take the longest and which could potentially be fast-tracked.
Bring in your team members, stakeholders, and project managers to determine the project scope.
- What are your goals?
- Which activities are essential?
- What deadlines do you have to meet?
- What resources are available?
Pro tip: Use FigJam’s mind map template to visualize your project activities and identify dependencies.
Step 2: Establish dependencies

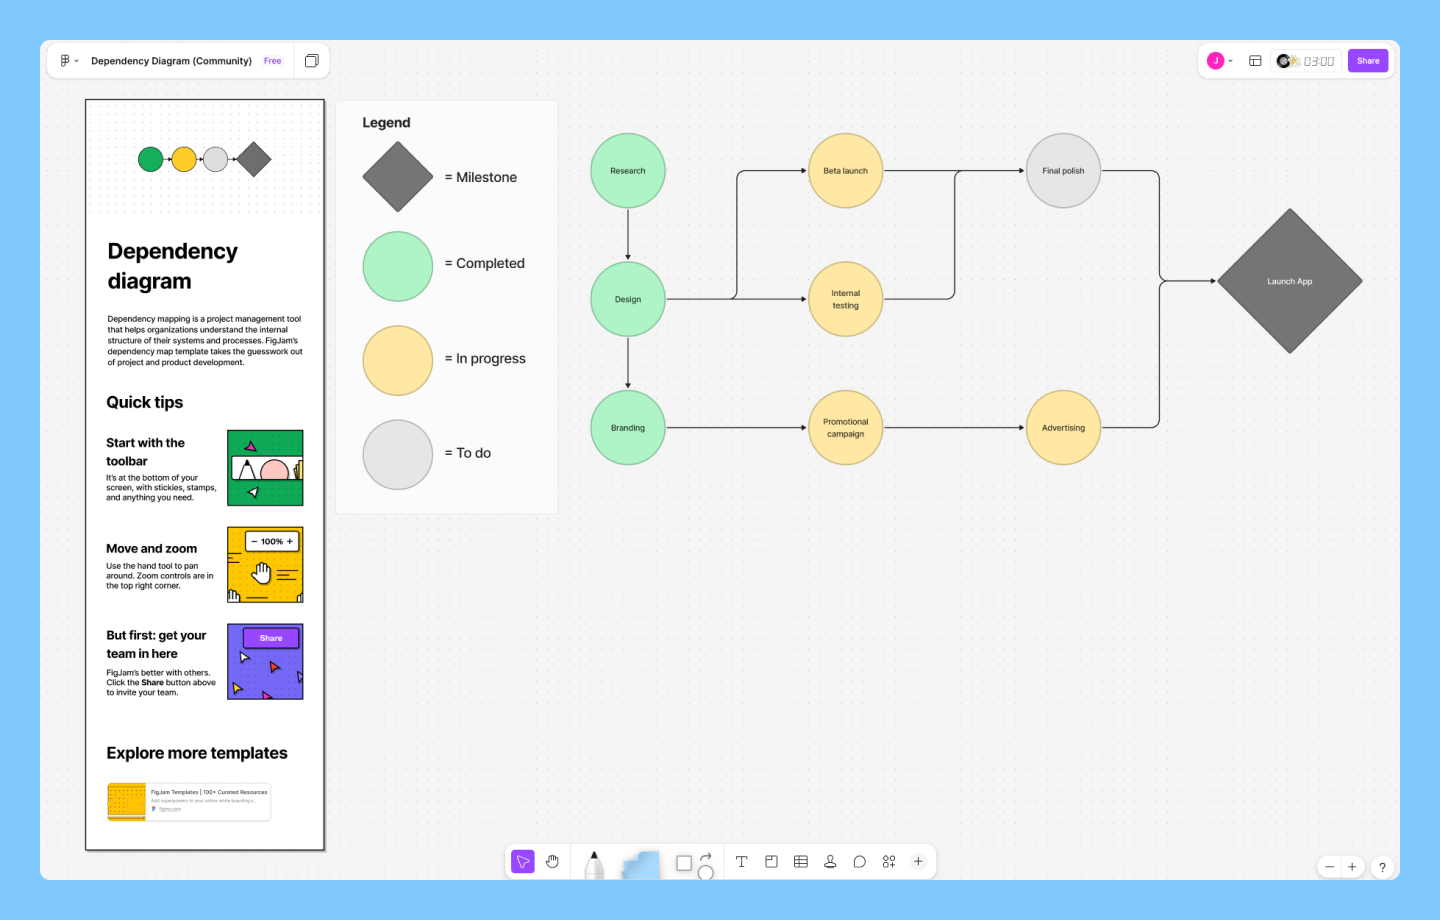
After listing your tasks, determine the order in which they must be completed. This involves identifying task dependencies, or the relationships between different activities. You’ll need to figure out which tasks are predecessors (must be finished before another can start) and which are successors (depend on a previous task to begin).
For example, a product team can’t begin “User Testing” until the “Interactive Prototype” is finished. Identifying these links early helps you avoid impossible scheduling overlaps.
Pro tip: Use FigJam’s dependency mapping template to visually link predecessors and successors, making even the most complex task sequences easy to track at a glance.
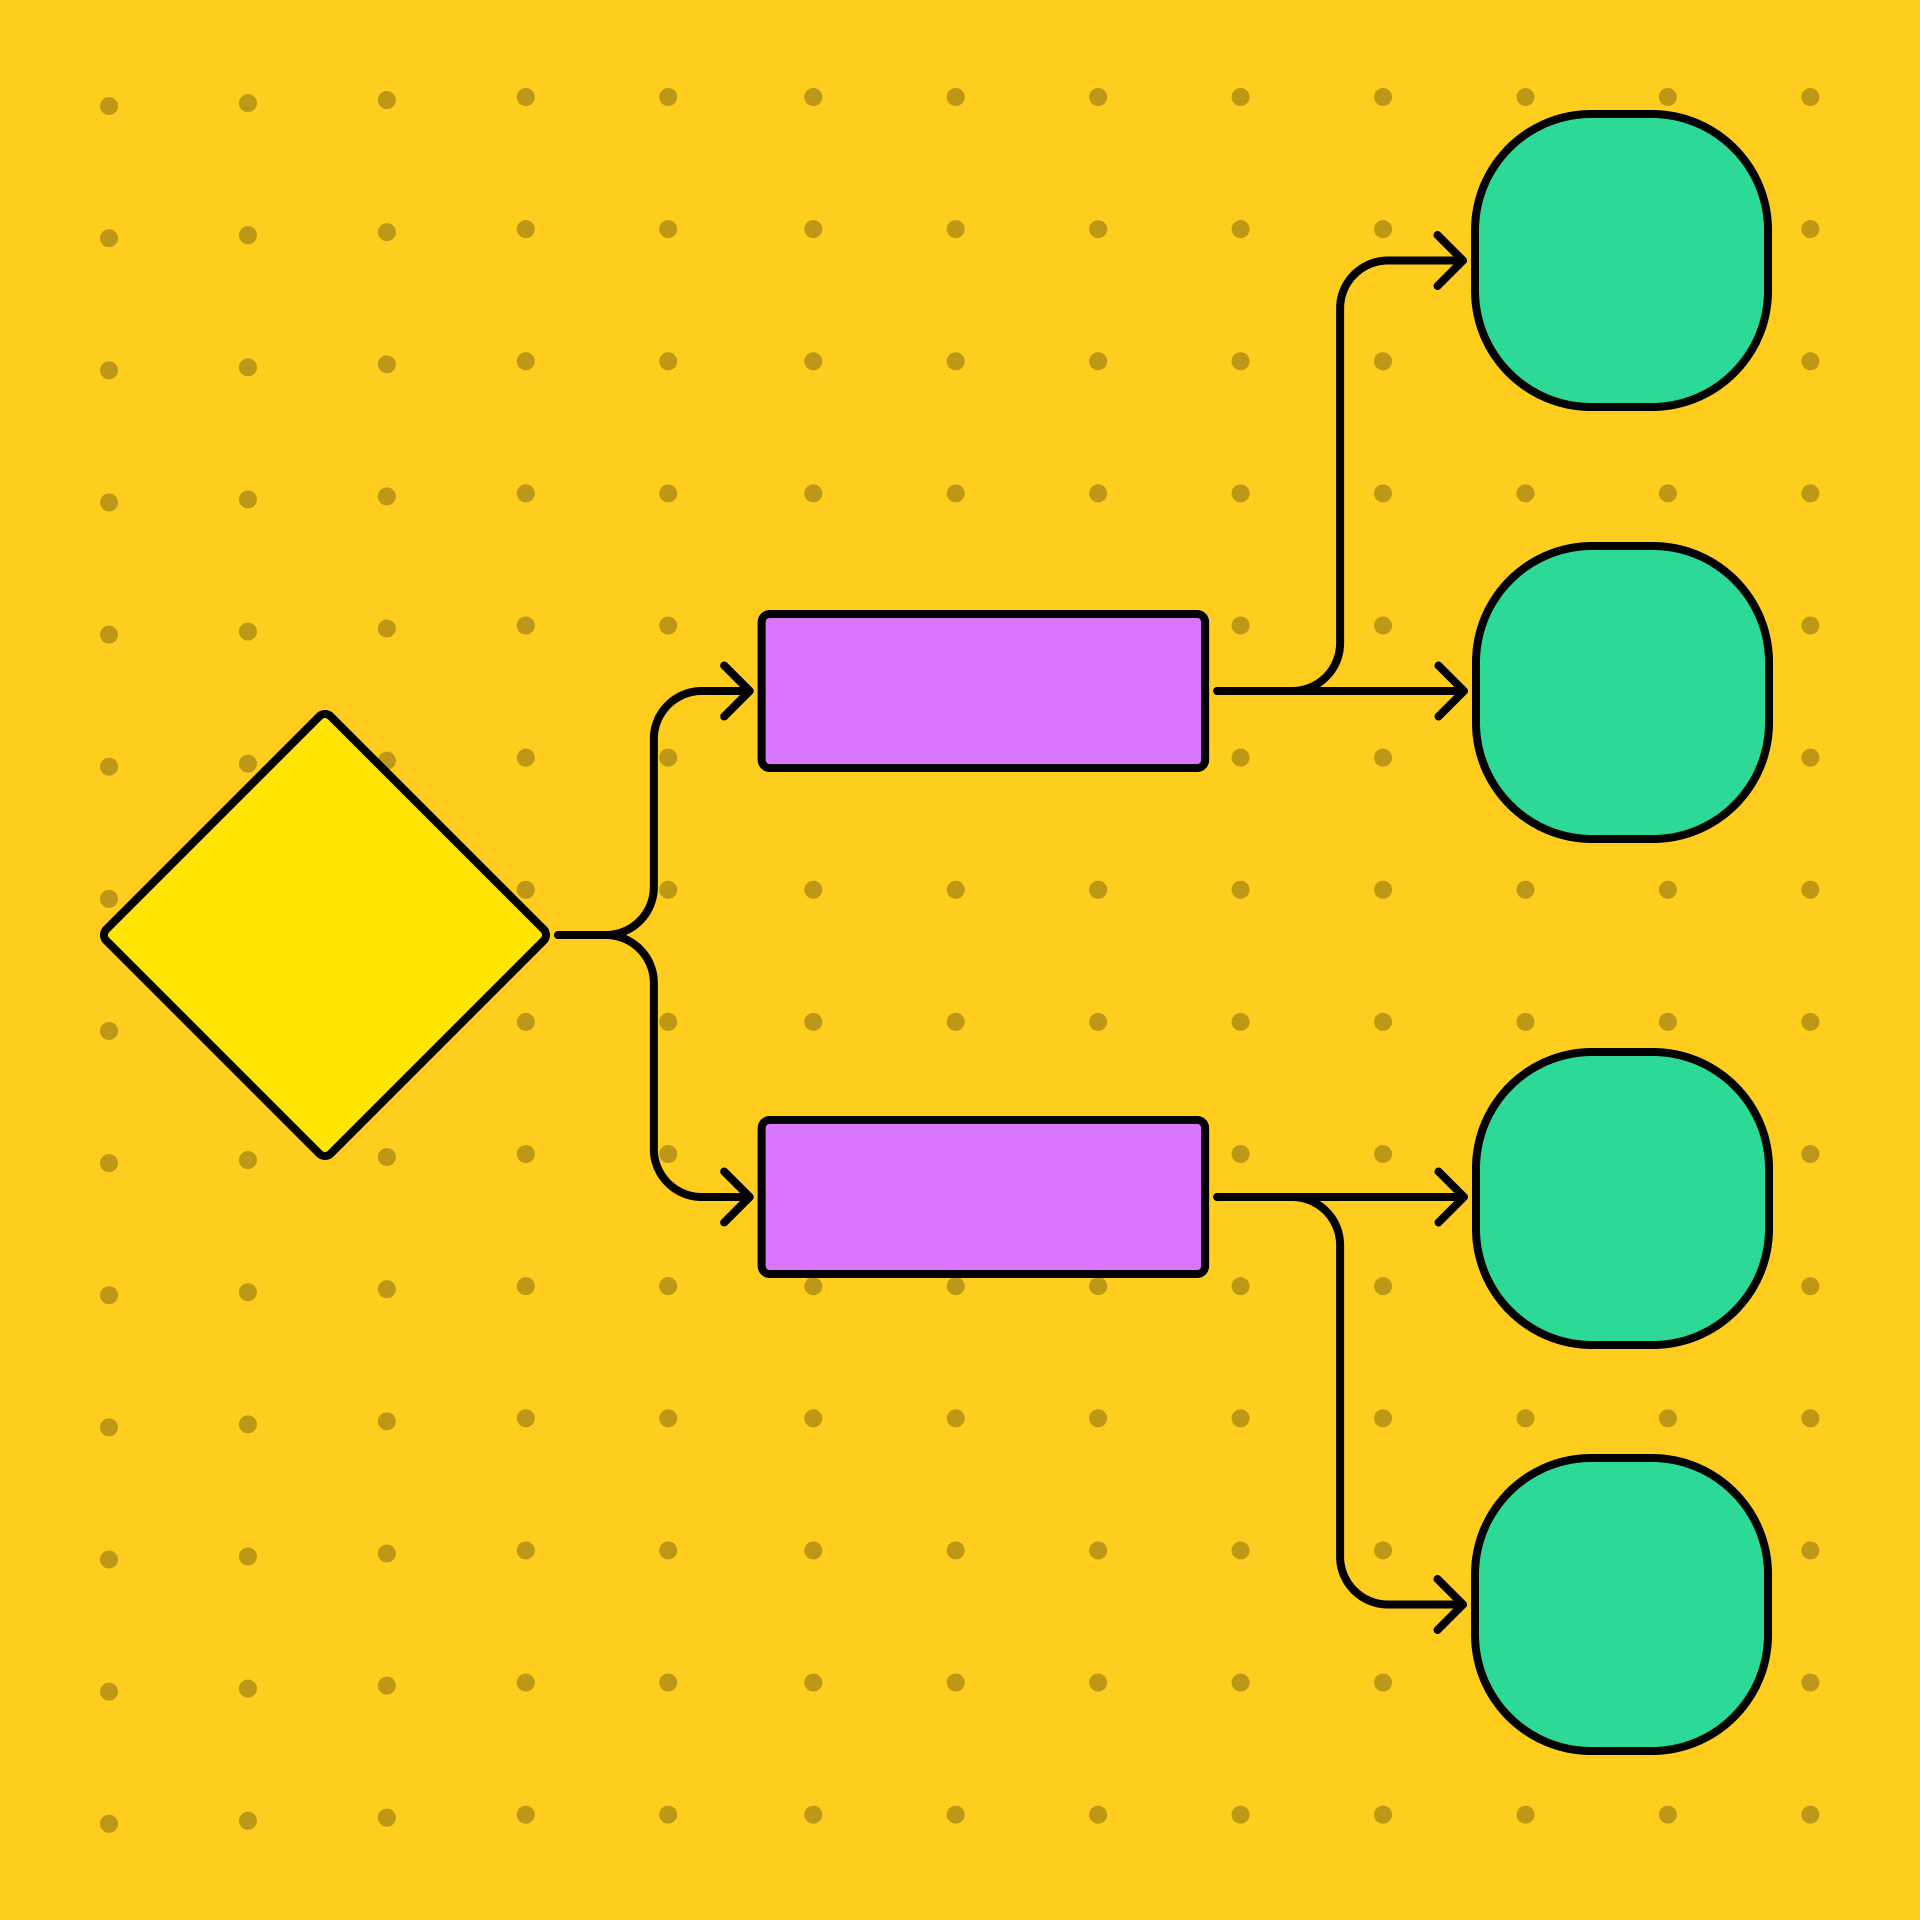
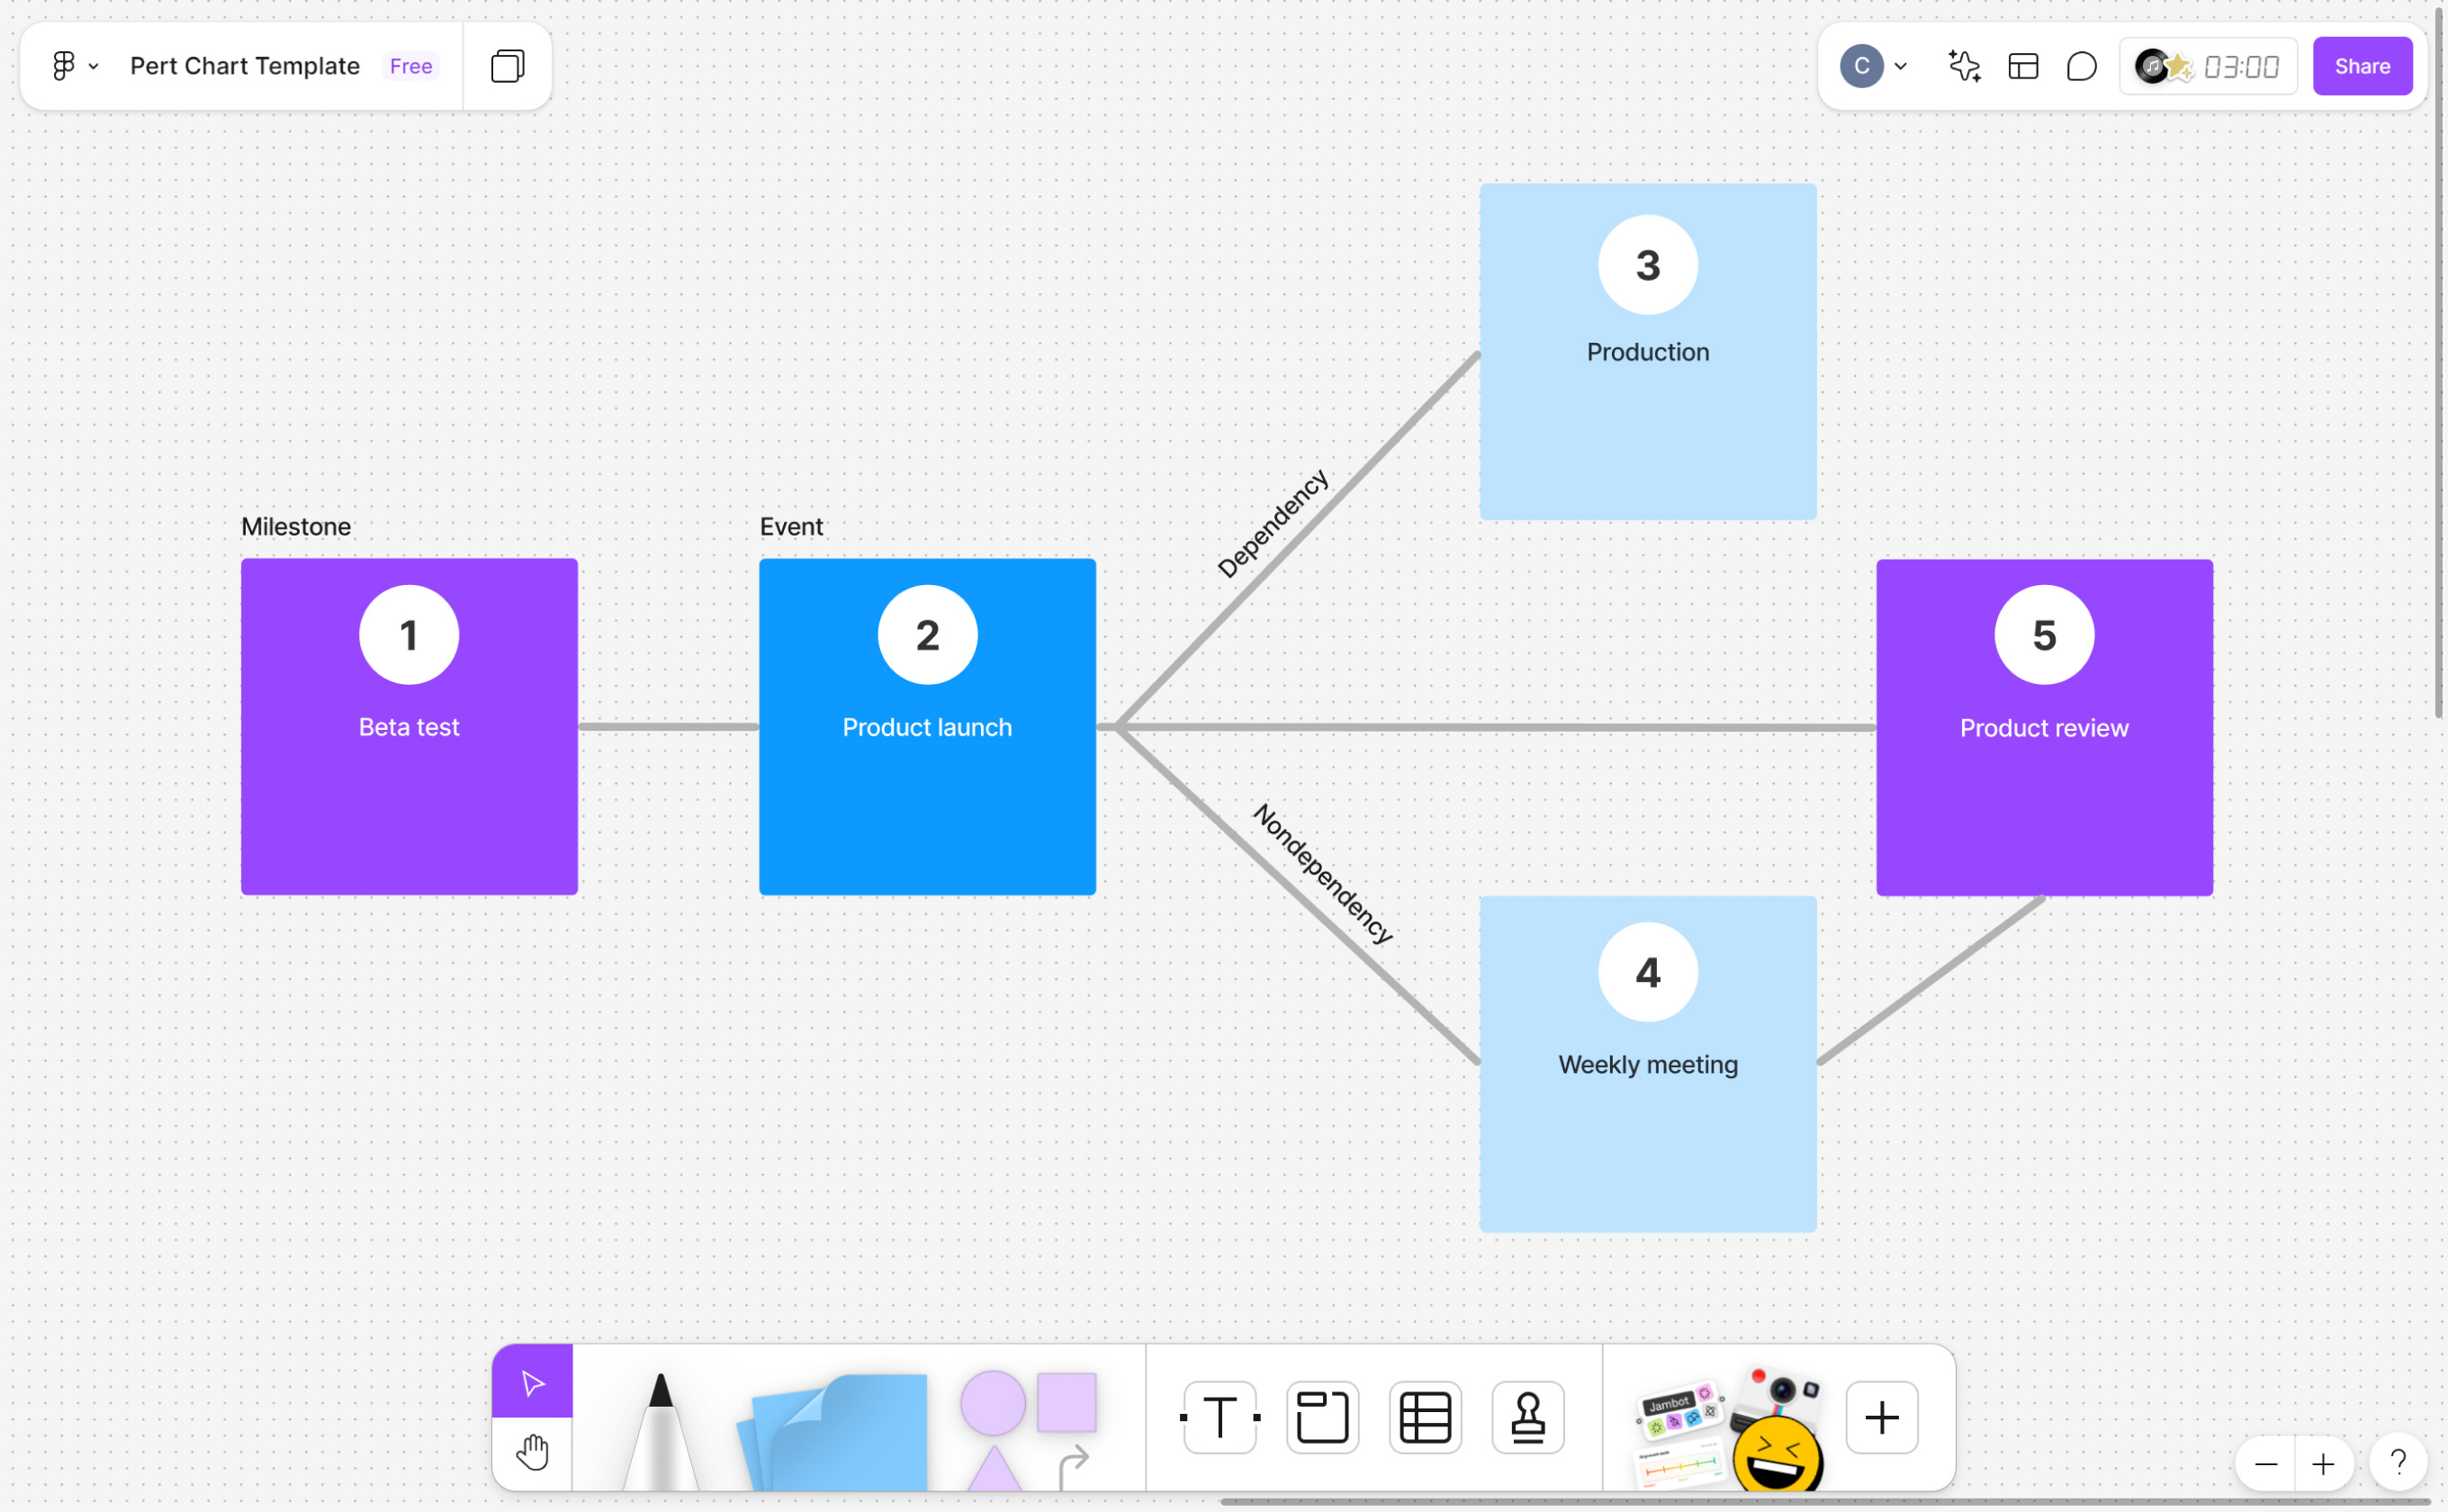
Step 3: Create a network diagram

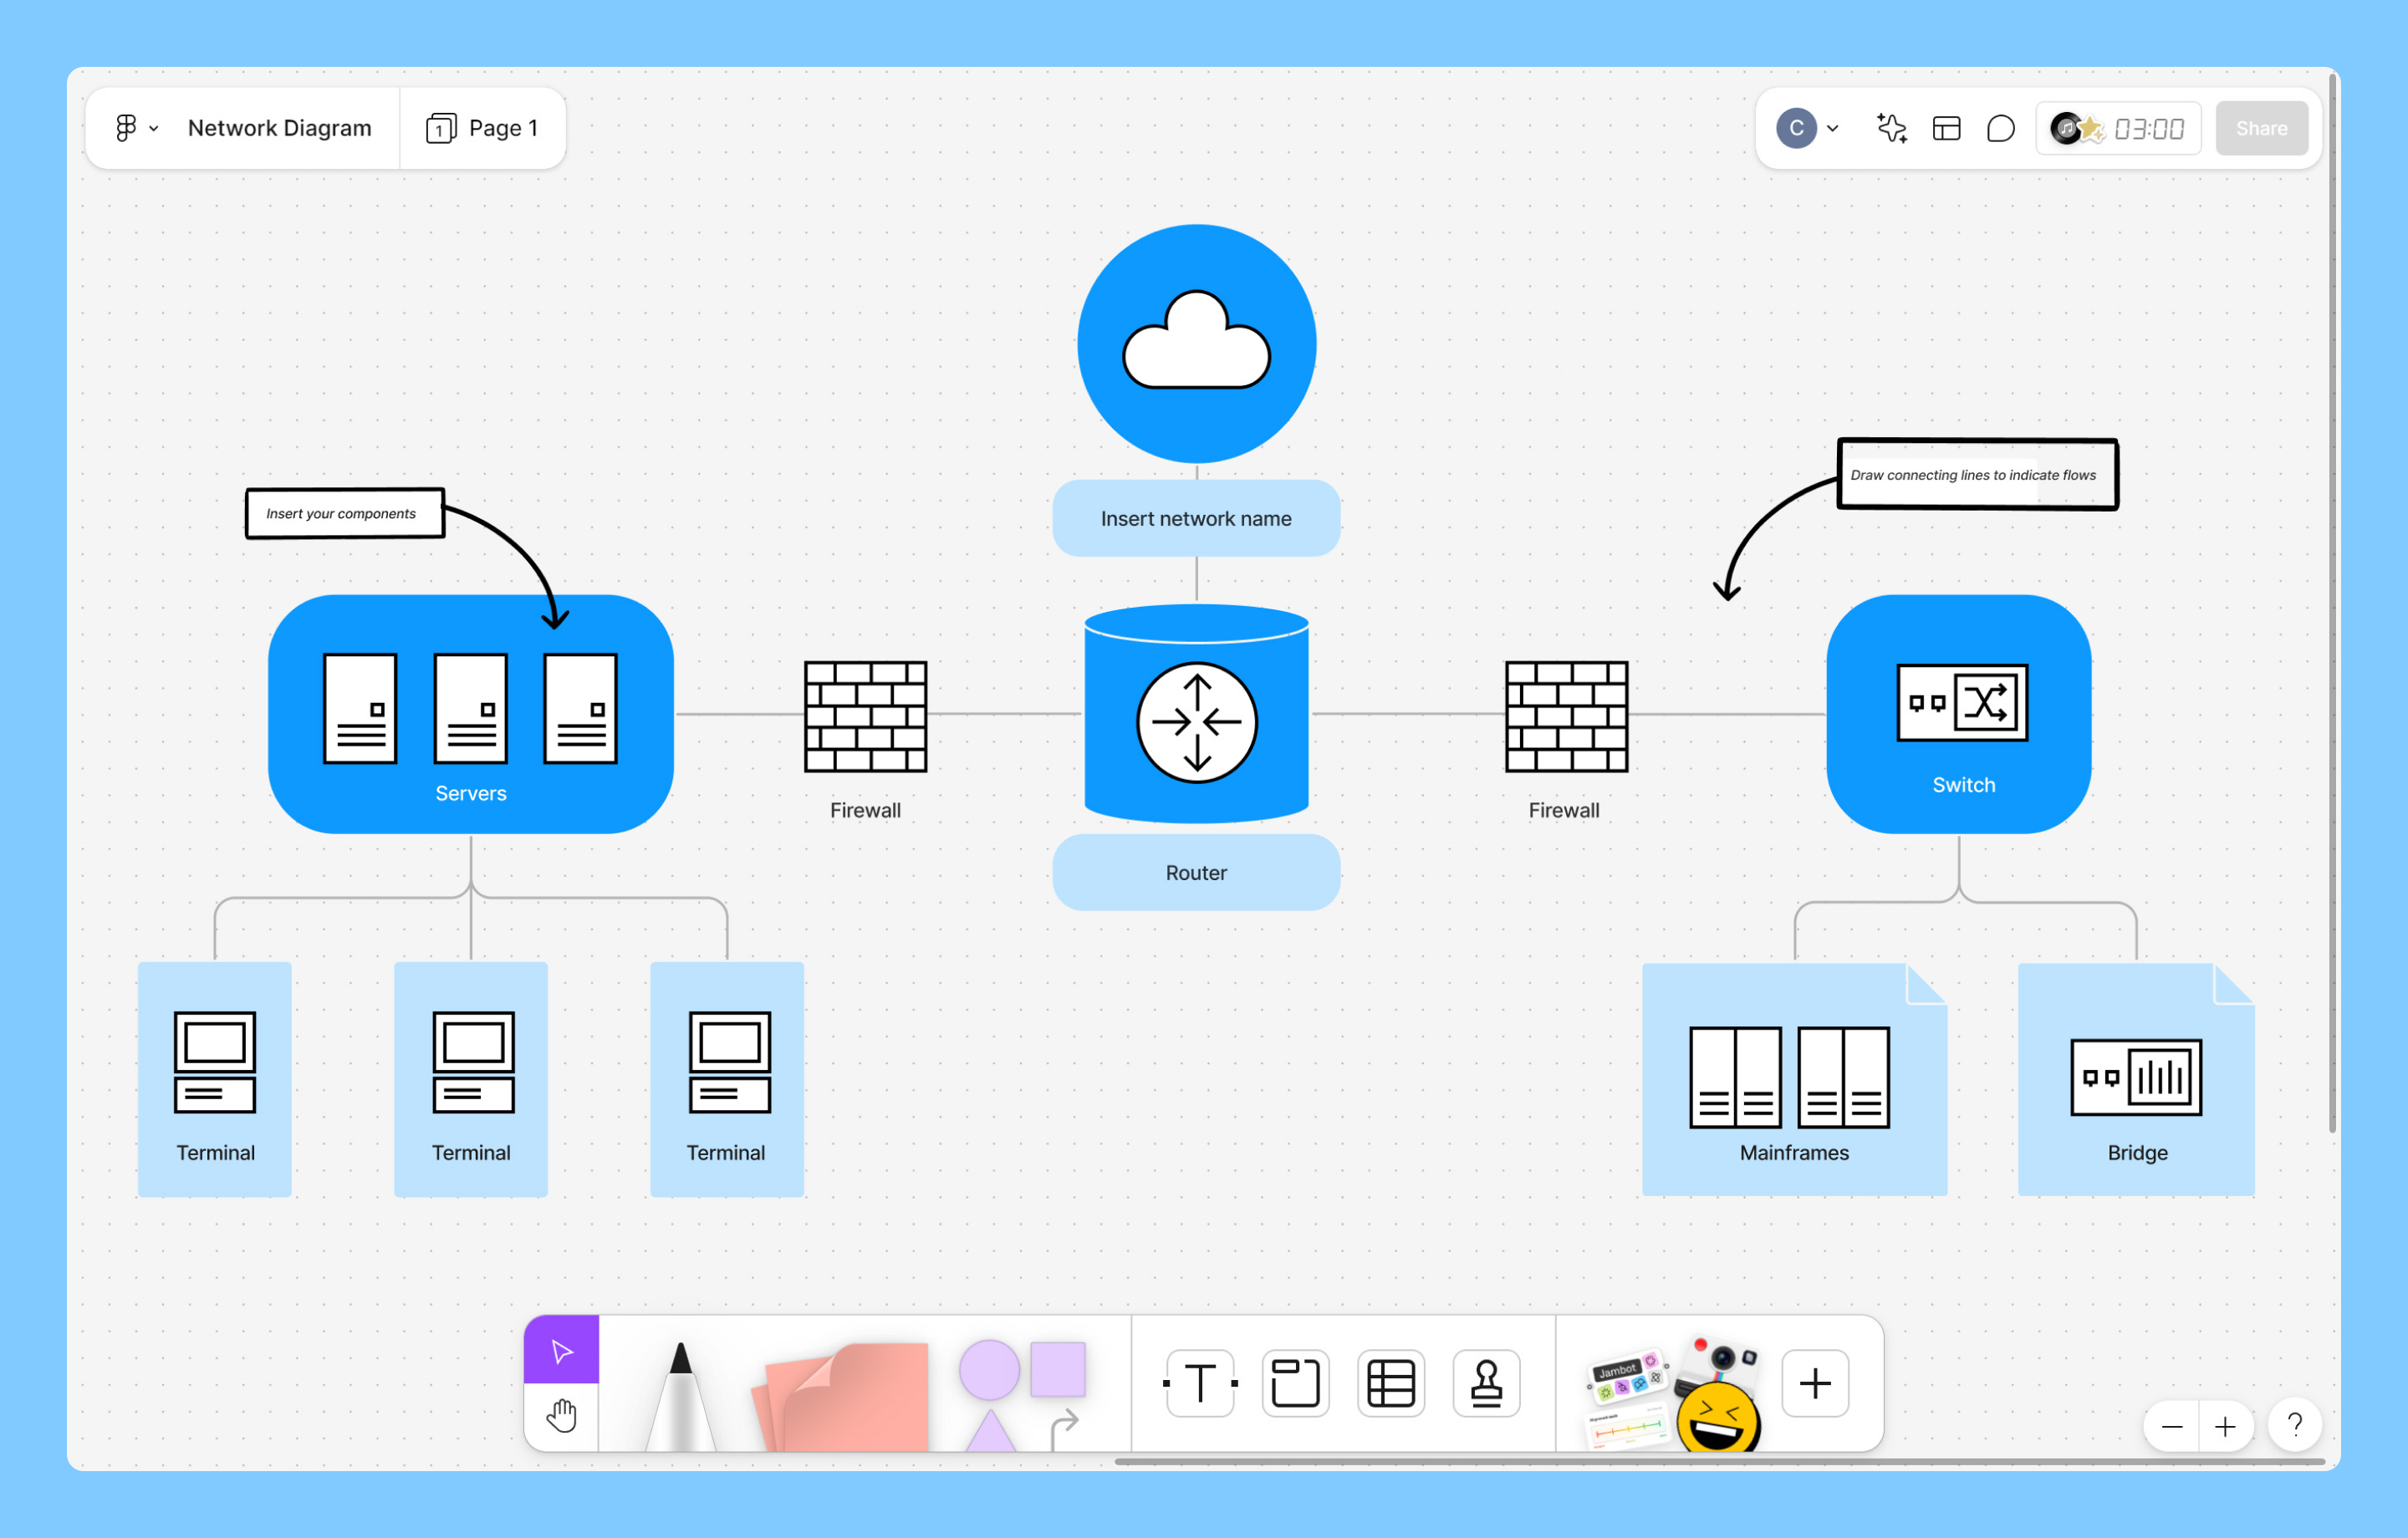
The next step is to make a network diagram. This visual representation shows the sequence of tasks and their dependencies.
To create your diagram, use a ready-made template or draw your own. Start by representing each task as a node. Then, use arrows to indicate the dependencies between tasks, as you’d see in a flowchart.
Pro tip: Use Figma’s network diagram templates for drag-and-drop simplicity and visual clarity.
Step 4: Determine activity durations

Estimate how long each task will take. Be sure to consider resource availability, task complexity, and potential risks, like a long feedback loop or a technical hurdle.
At this stage, your goal is to assign a single time value (e.g., three days or one week) to each node in your network diagram. Accuracy is key here—if your estimates are too optimistic, your final critical path calculation will be unrealistic. Once these values are set, you have the data needed to begin your technical calculations.
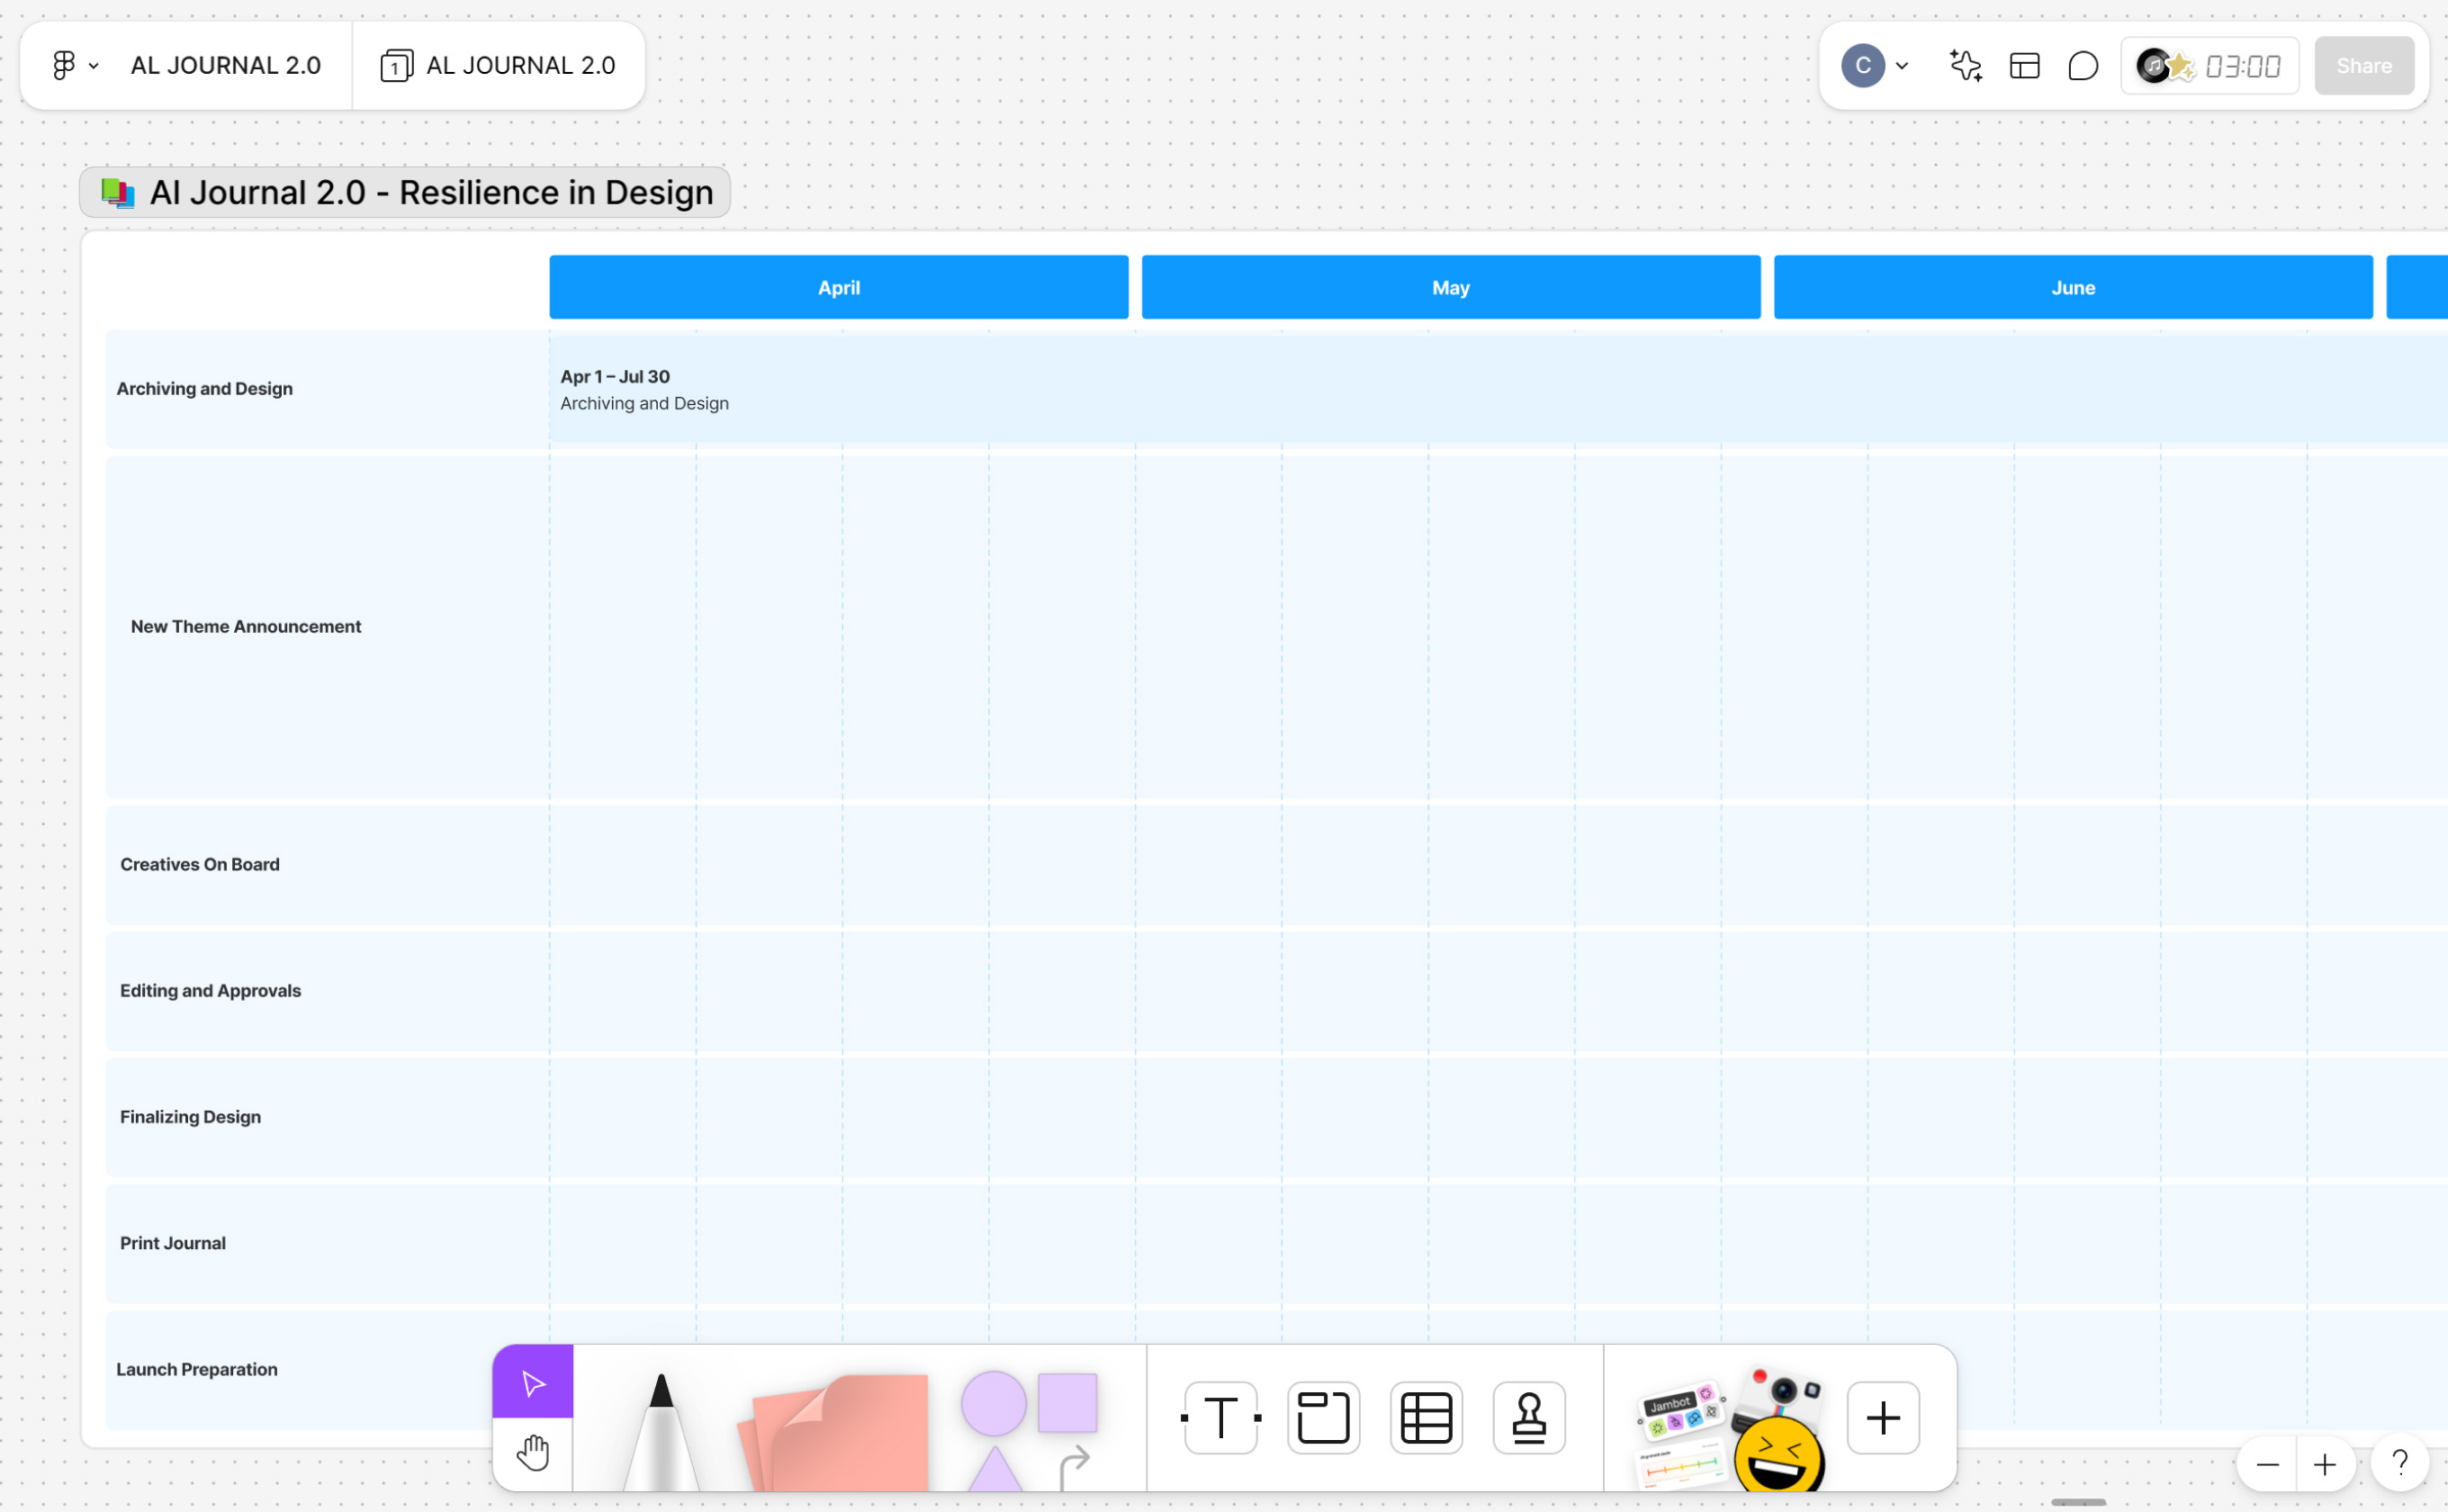
Pro tip: Use a Gantt chart or a timeline view in FigJam to visualize these individual durations side by side.
Step 5: Identify the critical path

Now you’re ready to identify the critical path—the longest sequence of activities from start to finish. To do this accurately, project managers use a technique called the forward and backward pass.
This involves calculating four key timing details for every task to see where you have flexibility and where you don’t:
- Earliest start time (ES): the earliest a task can begin after preceding tasks are finished
- Earliest finish time (EF): the earliest a task can end (ES + duration)
- Latest finish time (LF): the latest a task can end without delaying the whole project
- Latest start time (LS): the latest a task can begin (LF - duration)
The critical path consists of activities with zero slack, meaning any delay in these activities will delay the entire project.
Pro tip: Use your network diagram alongside PERT or Gantt charts to verify task duration estimates, resource allocation requirements, and projected completion dates.
Step 6: Calculate float and analyze progress

The final step in the process is identifying your float (also known as slack). Float is the amount of time a task can be delayed without impacting the project’s overall timeline.
There are two types of float to keep in mind:
- Total float: how much time a task can be delayed without pushing the project’s end date.
- Free float: how much time a task can be delayed without delaying the start of the next dependent task.
Here’s how to calculate each one:
- Total float = Latest Start (LS) – Earliest Start (ES) or Latest Finish (LF) – Earliest Finish (EF)
- Free float = Early Start of next task – Early Finish of current task
Once you’ve calculated float, use it to track progress. Keeping an eye on your critical path helps you catch delays early so you can reallocate resources, reprioritize tasks, or adjust scope before risks turn into blockers.
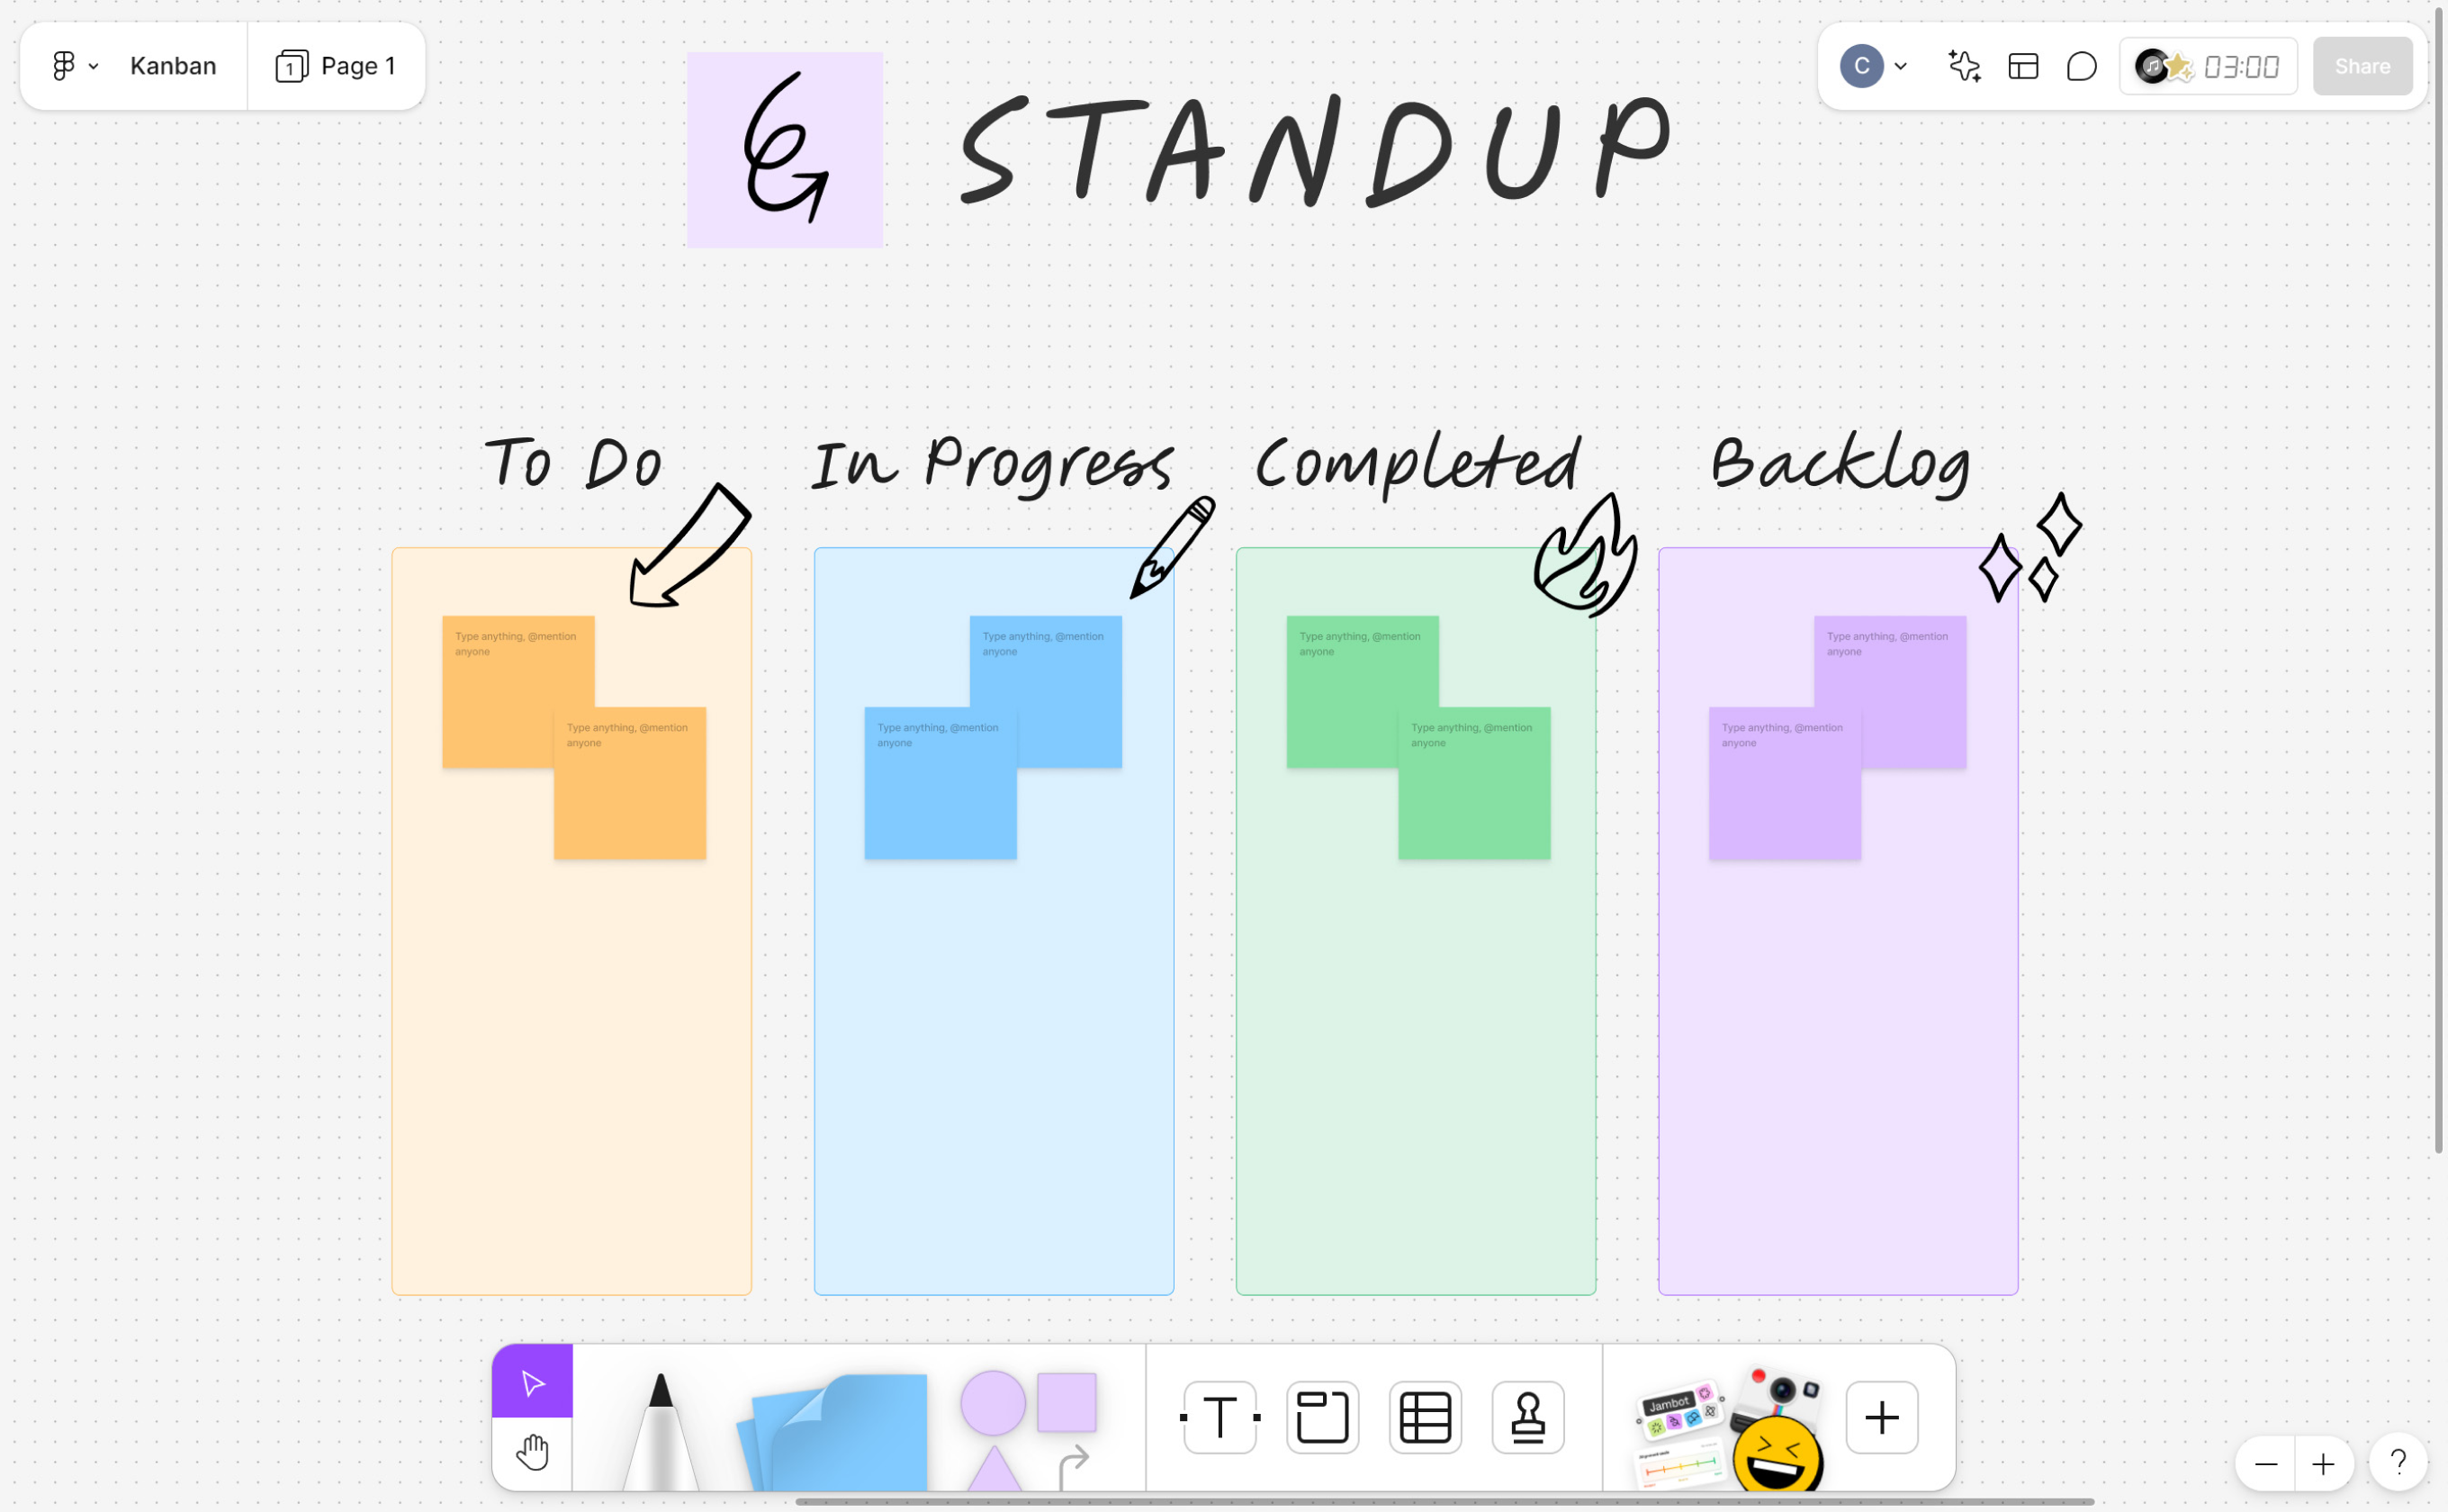
Pro tip: Use a FigJam Kanban board with status stickers to surface float in real time. Mark tasks “at risk,” “on track,” or deprioritized so your team can quickly align and act.
Build your critical path in FigJam
FigJam is a collaborative whiteboarding tool that helps teams visually map task dependencies, calculate project timelines, and identify bottlenecks in a shared digital canvas.
Critical path method example
Here’s an example of how critical path analysis might look in a standard product design project—launching a new app feature.
Step 1: Identify activities and WBS. Start by breaking the project into individual tasks:
- User research
- UI design
- Interactive prototyping
- Developer handoff
- Marketing copywriting
Step 2: Establish dependencies. Next, map out what depends on what:
- UI design starts after user research wraps.
- Interactive prototyping depends on completed UI design.
- Marketing copy can happen in parallel with the design work, but it must be completed before the final launch.
Step 3: Create a network diagram. UseFigJam to visualize the sequence, using arrows to show the flow from research to handoff.
Step 4: Determine activity durations. Assign time estimates based on your team’s capacity:
- User research: 5 days
- UI design: 10 days
- Interactive prototyping: 3 days
- Developer handoff: 2 days
- Marketing copywriting: 4 days
Step 5: Identify the critical path. After running forward and backward pass, you determine the longest chain of dependent tasks:
- User research → UI design → Prototyping → Handoff
- That sequence totals 20 days—this is your critical path.
Step 6: Calculate float. Now analyze the flexibility in parallel tasks.
- Marketing copy, for example, isn’t on the critical path.
- Using float calculations (Latest start date - Earliest Start = 16 - 5 = 11), you find it has 11 days of total float.
- This gives the marketing team significant flexibility without impacting launch. They could start a week late or take twice as long as expected without affecting the developer handoff or the final feature launch.
- Meanwhile, design-related tasks have zero float, so that’s where you’ll want to monitor progress most closely and allocate resources accordingly to prevent delays.
Benefits of using the critical path method

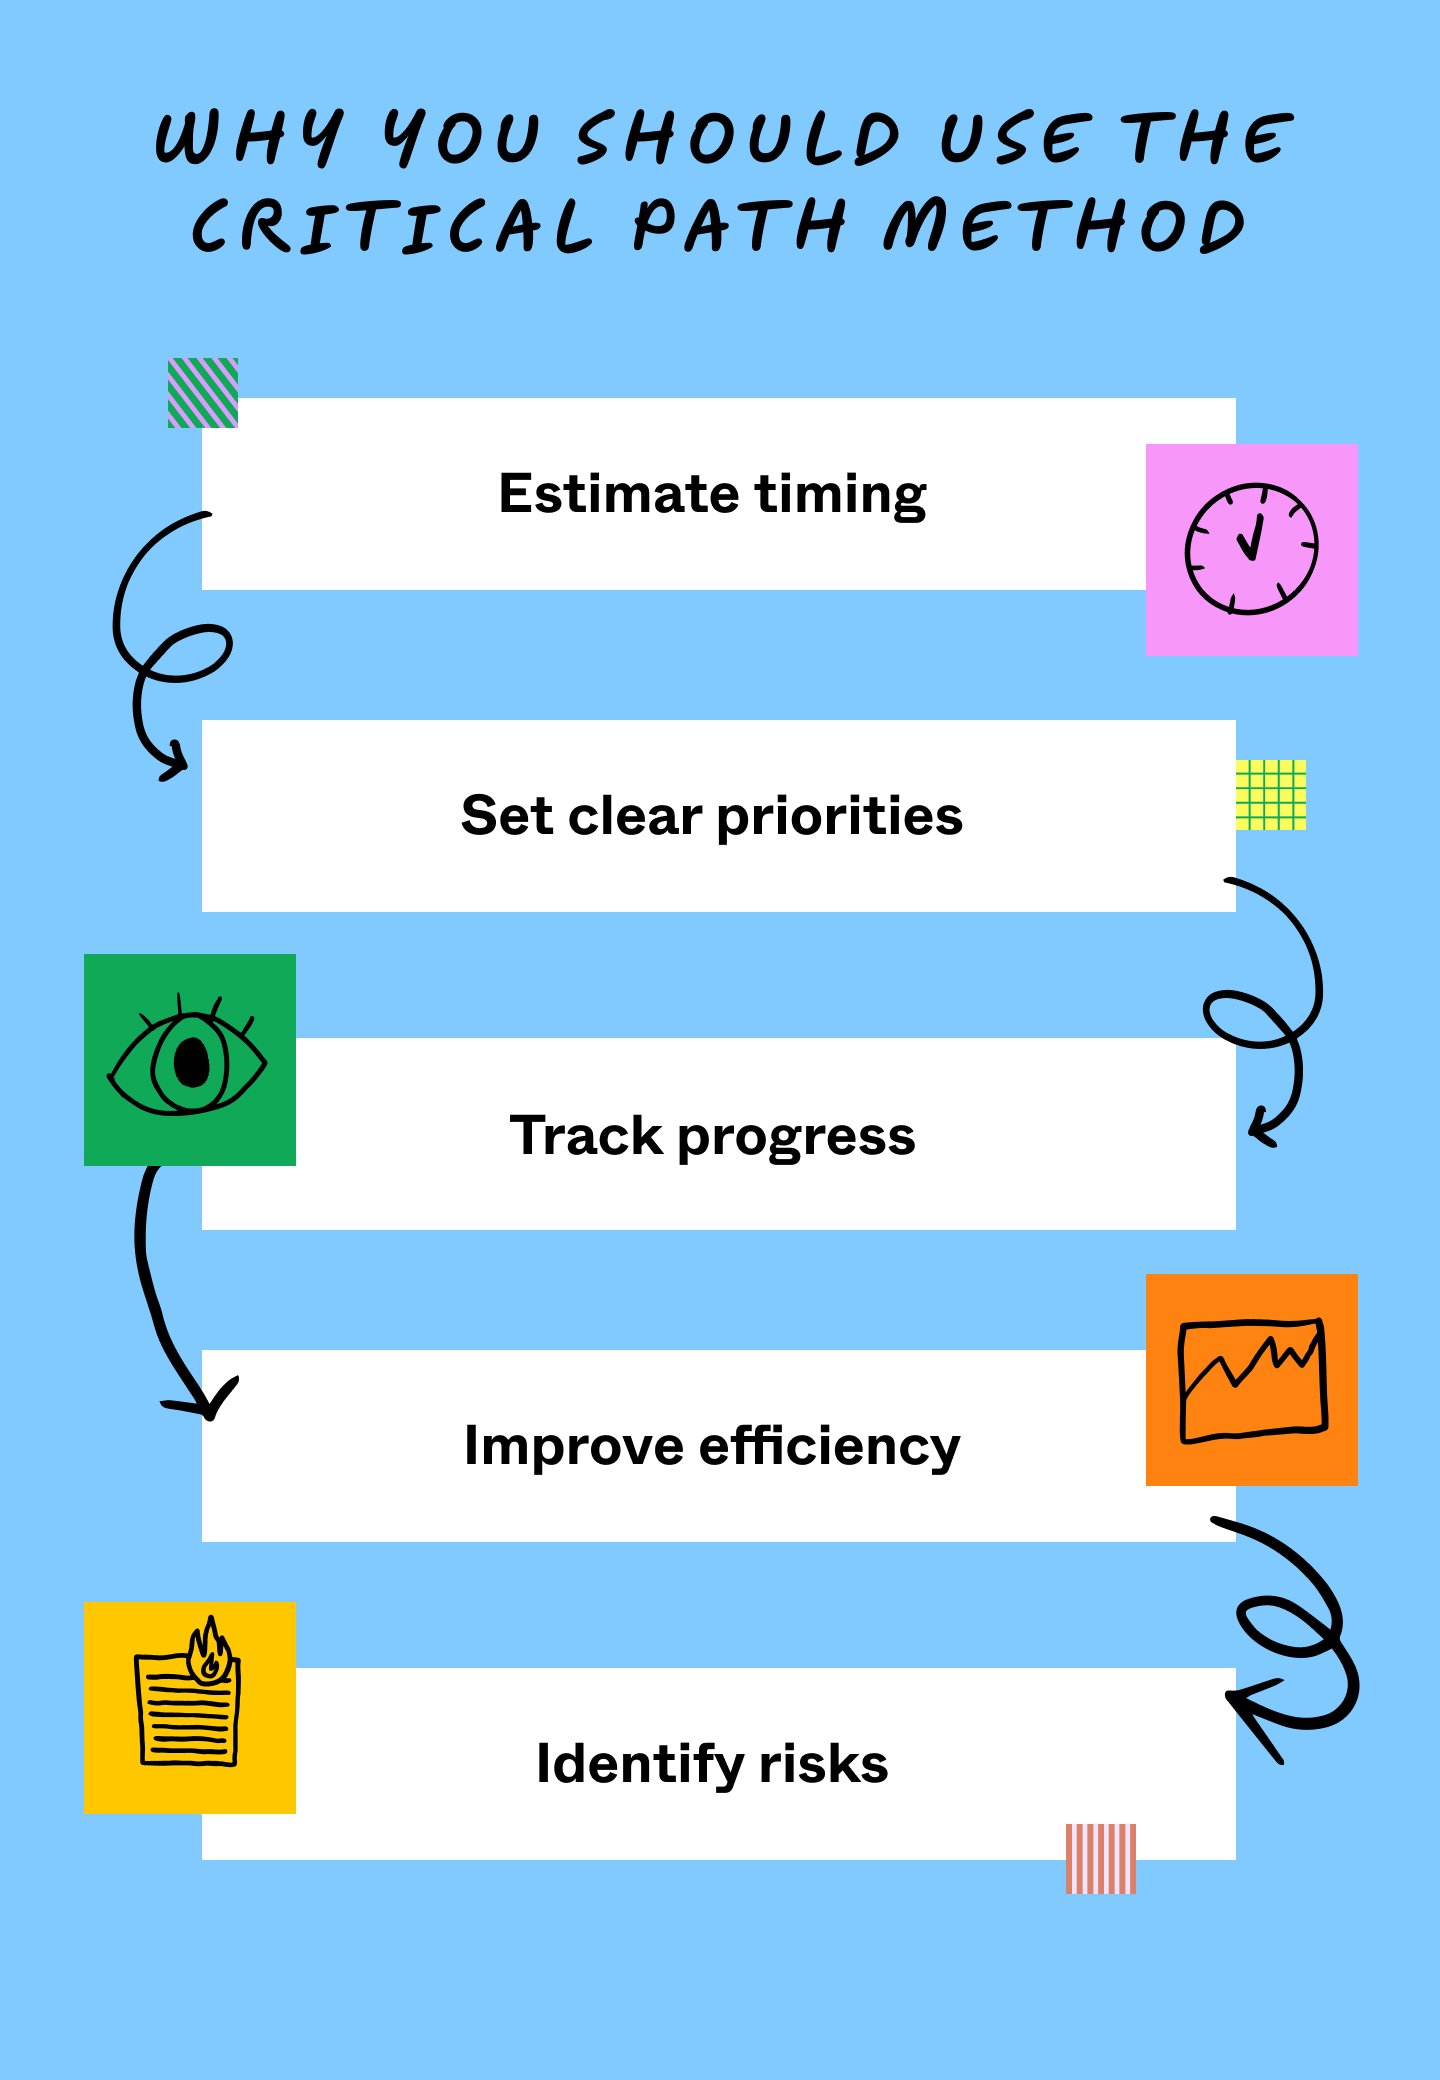
Here are five ways CPM can transform your project management:
- Estimate timing with confidence. CPM helps you identify and sequence tasks essential to meeting project goals. Align these critical tasks, and you’ll see the longest path to project completion. This timeline serves as your baseline for setting realistic milestones and planning future projects with greater accuracy.
- Set clear priorities. Once you know your critical path, deciding what needs attention becomes clearer. CPM helps you flag task dependencies and de-prioritize non-critical activities to avoid delays. This allows you to focus on critical tasks while allocating resources effectively.
- Track progress. With your project scope and end date set, you can hit your start date running—and begin tracking actual progress on critical path activities. Monitoring progress allows you to meet deadlines and make adjustments where needed.
- Improve team efficiency. Understanding which tasks are truly critical helps everyone work smarter, not harder. Teams can focus their energy where it counts most, reducing wasted effort and keeping project costs in check.
- Identify risks early. Your critical path helps identify potential risks and bottlenecks before they slow you down. This foresight lets you develop backup plans and adjust resources proactively rather than scrambling to catch up later.
How to manage the critical path
If your critical path reveals a timeline that’s too long, you don’t have to cut scope to stay on track. Instead, use schedule compression—a way to shorten the timeline without reducing the project’s deliverables. There are two ways to do this:
- Fast-tracking: Run tasks in parallel that were originally planned in sequence. For example, your design team might start building a design system in Figma while final wireframes are still being polished.
- Crashing: Add more people to a critical task to speed it up. Sometimes, it’s as simple as using multi-player collaboration to bring more designers into a single file and finish a complex prototype faster.
By identifying your critical path early, you can make adjustments before delays impact your team or stakeholders.
Jumpstart your critical path diagram with FigJam
Mapping a critical path is about aligning every designer, developer, and stakeholder on the sequence of work that matters most. FigJam brings the critical path method into your shared design environment, replacing static spreadsheets with a living, multi-player canvas.
Here’s how to get started:
- Use FigJam to map out your network diagrams and calculate float alongside your team in a shared, real-time canvas.
- Explore Figma’s project management templates to organize your tasks into a structured work breakdown structure quickly.
- Use Dev Mode to shorten your critical path by letting developers inspect and build from work-in-progress designs.
Ready to map out your own critical path?
FigJam is a collaborative whiteboarding tool that helps teams brainstorm, plan, and organize complex project workflows together in one shared space.