What is a Likert scale?


Share What is a Likert scale?
Explore more from
Team productivity


Think about the last time you rated your satisfaction with a product or service on a scale of one to five. You were using a Likert scale, named after its inventor, psychologist Rensis Likert. But what is a Likert scale?
Put simply, a Likert scale is a tool for assessing opinions, attitudes, and perceptions. Ready to learn how these tools can help gather valuable feedback about user experiences and preferences.?
Read on to learn:
- What questions appear on a Likert scale
- The benefits of Likert scales
- When to use them
- How to create one
- Example questions
What are Likert scale questions?
Likert scales measure how people feel about products, ads, or experiences using a 5- to 7-point scale ranging from “strongly disagree” to “strongly agree.” The scale can also include a range of “always” to “never,” for instance, or similar options.

When you should use the Likert scale
Product teams have plenty of opportunities to leverage the Likert scale, from gathering user feedback to evaluating team alignment.
For example, a designer might create a Likert scale survey to conduct usability testing on an application. Users can select a rating for statements like, “The interface was intuitive” or “The design was visually appealing.” The results can help designers and product managers understand user sentiment and perceptions, as well as areas for improvement.
A Likert scale can also help assess a team’s alignment or opinion on a particular product decision. In this case, the questions may revolve around how well a certain choice aligns with the brand identity or design guidelines.
Benefits of using the Likert scale
Some of the main benefits of leveraging Likert scales include:
- Ease of use. Simple and straightforward questions make the Likert scale easy for both designers and respondents. There’s no need to design complex questionnaires or expect users to write lengthy responses.
- Quantitative data. Likert scales transform feedback into numerical data that are easy to analyze and visualize. This helps designers measure user satisfaction, experiences, and pain points.
- Standardization. The uniform format ensures consistent, reliable data collection over time. Teams can reuse questions to track progress and measure improvements.
- Versatility. It’s easy to adapt Likert scales for various contexts and audiences, from end users to external stakeholders. Likert scales work well in surveys, usability testing, and in-person sessions.
How to use the Likert scale and create questions
Likert survey questions can prompt users to share valuable insights, but you have to craft them carefully. Once you familiarize yourself, it’s simple to tap into the power of Likert scale questionnaires for your research projects.
Step 1: Identify your research goals
First, understand what you're trying to measure and what data you need to collect. Are you trying to gauge user satisfaction, stakeholder preferences, usability, or something else?
Your objective shapes your survey questions and scales. In Figma’s user research resources, you can see how to use Likert scales to rate a website’s user experience. Instead of relying on numbers, this example uses a Likert scale with emojis that represent user responses. The Likert scale prompts represent a range of possible user responses, from “navigation makes me super happy” to “this page experience makes me angry.”
Step 2: Choose your scale
Select between a 5-point Likert scale for a simpler option or a 7-point Likert scale for more nuanced feedback. Typical formats include:
- Agreement (strongly disagree to strongly agree)
- Frequency (never to always)
- Satisfaction (very dissatisfied to very satisfied)
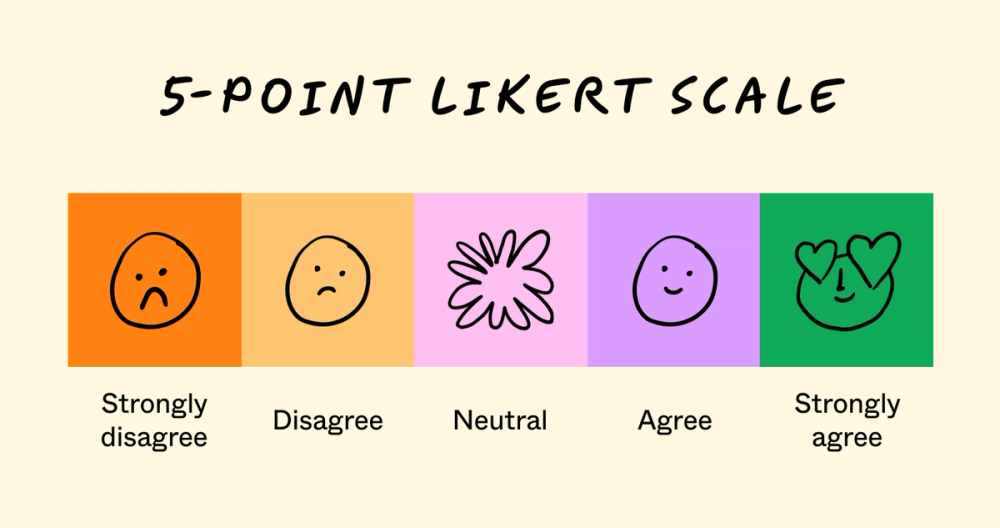
Here’s an example of a 5-point Likert scale:
- Strongly disagree
- Disagree
- Neutral
- Agree
- Strongly agree
And here’s an example of a 7-point Likert scale:
- Strongly disagree
- Disagree
- Slightly disagree
- Neutral
- Slightly agree
- Agree
- Strongly agree
While some academics prefer 7-point scales for accuracy, 5- and 3-point scales are easier to understand and follow—especially for users filling out long questionnaires. Once you decide how many points to use, apply that scale to future projects so you can compare results accurately.
Step 3: Design your questionnaire
When designing your Likert scale, write clear, focused questions that avoid bias. Always include explicit instructions so users understand exactly how to answer each question. For example, instructions might read: “Please indicate your level of agreement with each statement: 1 indicates ‘strongly disagree,’ and 5 indicates ‘strongly agree.’”
Find inspiration from Likert scale examples from similar projects. Consider what works and what doesn’t—steer clear of leading or culturally specific wording that could introduce bias. For example, “How easy did you find our seamless ordering process?” is a leading question. “Please rate your level of ease navigating through our ordering process” is a more neutral instruction.
Remember, some users may strongly agree with all questions to please the researcher or finish quickly. To counter response bias, consider including reverse-worded questions for response scales. For example, “Please rate the level of difficulty you experienced during checkout.”
Step 4: Analyze your data
Once you’ve received survey responses, transform them into actionable insights.
Start by aggregating the responses to understand the frequency of each option—for instance, how many respondents selected “agree” or “strongly disagree.” Then, calculate percentages to see the distribution across the scale.
Imagine you presented users with the statement, “I found the checkout process simple and intuitive,” and received these responses:
- Strongly agree: 40%
- Agree: 30%
- Neither agree nor disagree: 20%
- Disagree: 5%
- Strongly disagree: 5%
You can see that 70% of respondents had a generally positive experience, while 10% did not.
Next, you can calculate the average response by assigning values to each scale option (e.g., strongly agree = 5) and multiplying by the percentage of responses for each option (e.g., 40% x 5). In this case, the average response is 4.2.
You may also be interested in the mode, or the most common response. In this case, that’s “strongly Agree,” which appears most often at 40%. It may also be beneficial to assess data across demographics, user segments, or other populations.
Once you’ve tallied and vetted your data, you can synthesize results and highlight key findings in a bar graph, chart, heatmap, or other visualization. Pay special attention to areas with low scores and any surprising trends. You can even incorporate answers into a user journey map to help you better understand your users.
Step 5: Take action on your findings
Focus first on the most pressing opportunities for improvement identified in your analysis. From there, create a clear action plan that assigns ownership and establishes timelines for implementing changes.
Share your findings with stakeholders using a tool like Figma Slides. You might also include any visualizations you’ve created while analyzing your data.
Remember to measure the impact of your changes by conducting follow-up surveys using the same scale format. This consistency ensures you can accurately track improvements over time.
Example Likert scale questions

While Likert scales are quite standardized, there are ways to customize them to your needs. Below are a few example questions to help you get started.
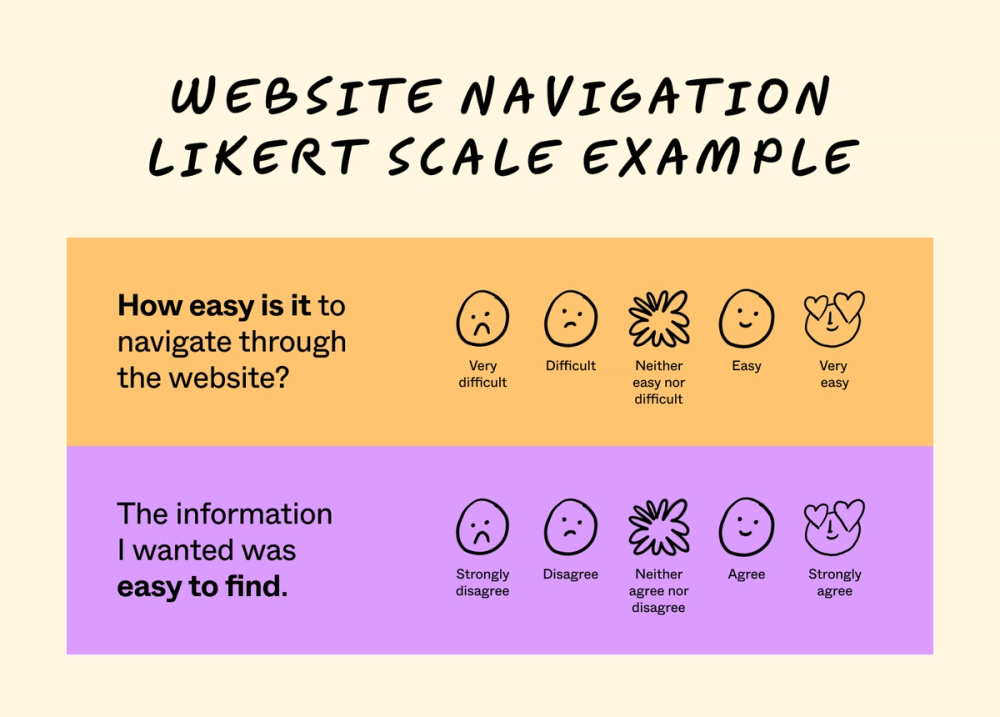
Website navigation question examples
Please indicate your answer to the following question, where 1 indicates “very easy” and 5 indicates “very difficult.” How easy is it to navigate through the website?
- Very easy
- Easy
- Neither easy nor difficult
- Difficult
- Very difficult
Please indicate your level of agreement with the following statement, where 1 indicates “strongly agree” and 5 indicates “strongly disagree.” The information I wanted was easy to find.
- Strongly agree
- Agree
- Neither agree nor disagree
- disagree
- Strongly disagree
The content on the page was presented clearly and concisely.
- Strongly agree
- Agree
- Neither agree nor disagree
- disagree
- Strongly disagree
Brand redesign questions
The brand redesign represents our brand in a positive way.
- Strongly agree
- Agree
- Neither agree nor disagree
- Disagree
- Strongly disagree
The brand visuals effectively communicate the intended message.
- Strongly agree
- Agree
- Neither agree nor disagree
- disagree
- Strongly disagree
The brand aligns with company values.
- Strongly agree
- Agree
- Neither agree nor disagree
- disagree
- Strongly disagree
Checkout cart experience questions
How easy did you find the checkout experience?
- Very Easy
- Easy
- Neither easy nor difficult
- Difficult
- Very difficult
The checkout experience offered the payment and delivery options I expected.
- Strongly agree
- Agree
- Neither agree nor disagree
- disagree
- Strongly disagree
My order details were accurate and clearly displayed throughout the checkout process.
- Strongly agree
- Agree
- Neither agree nor disagree
- disagree
- Strongly disagree
Jumpstart Likert scale user research with FigJam
If you strive for happy users and intuitive designs, leveraging Likert scales can help you gain quantifiable data, detailed insights, and a glimpse into the user’s perspective. Build Likert scales and improve your user research with FigJam’s collaborative online whiteboard. Here’s how:
- Use Figjam’s Likert scale template to create, evaluate, and present questionnaires.
- Solicit real-time input from your team with audio, stamps, and emojis on FigJam’s online strategic planning tool.
- Create compelling presentations and visuals to display results with Figma Slides.
Ready to build a Likert scale?